01Executive summary
The headline numbers, stated at the confidence the data actually warrants.
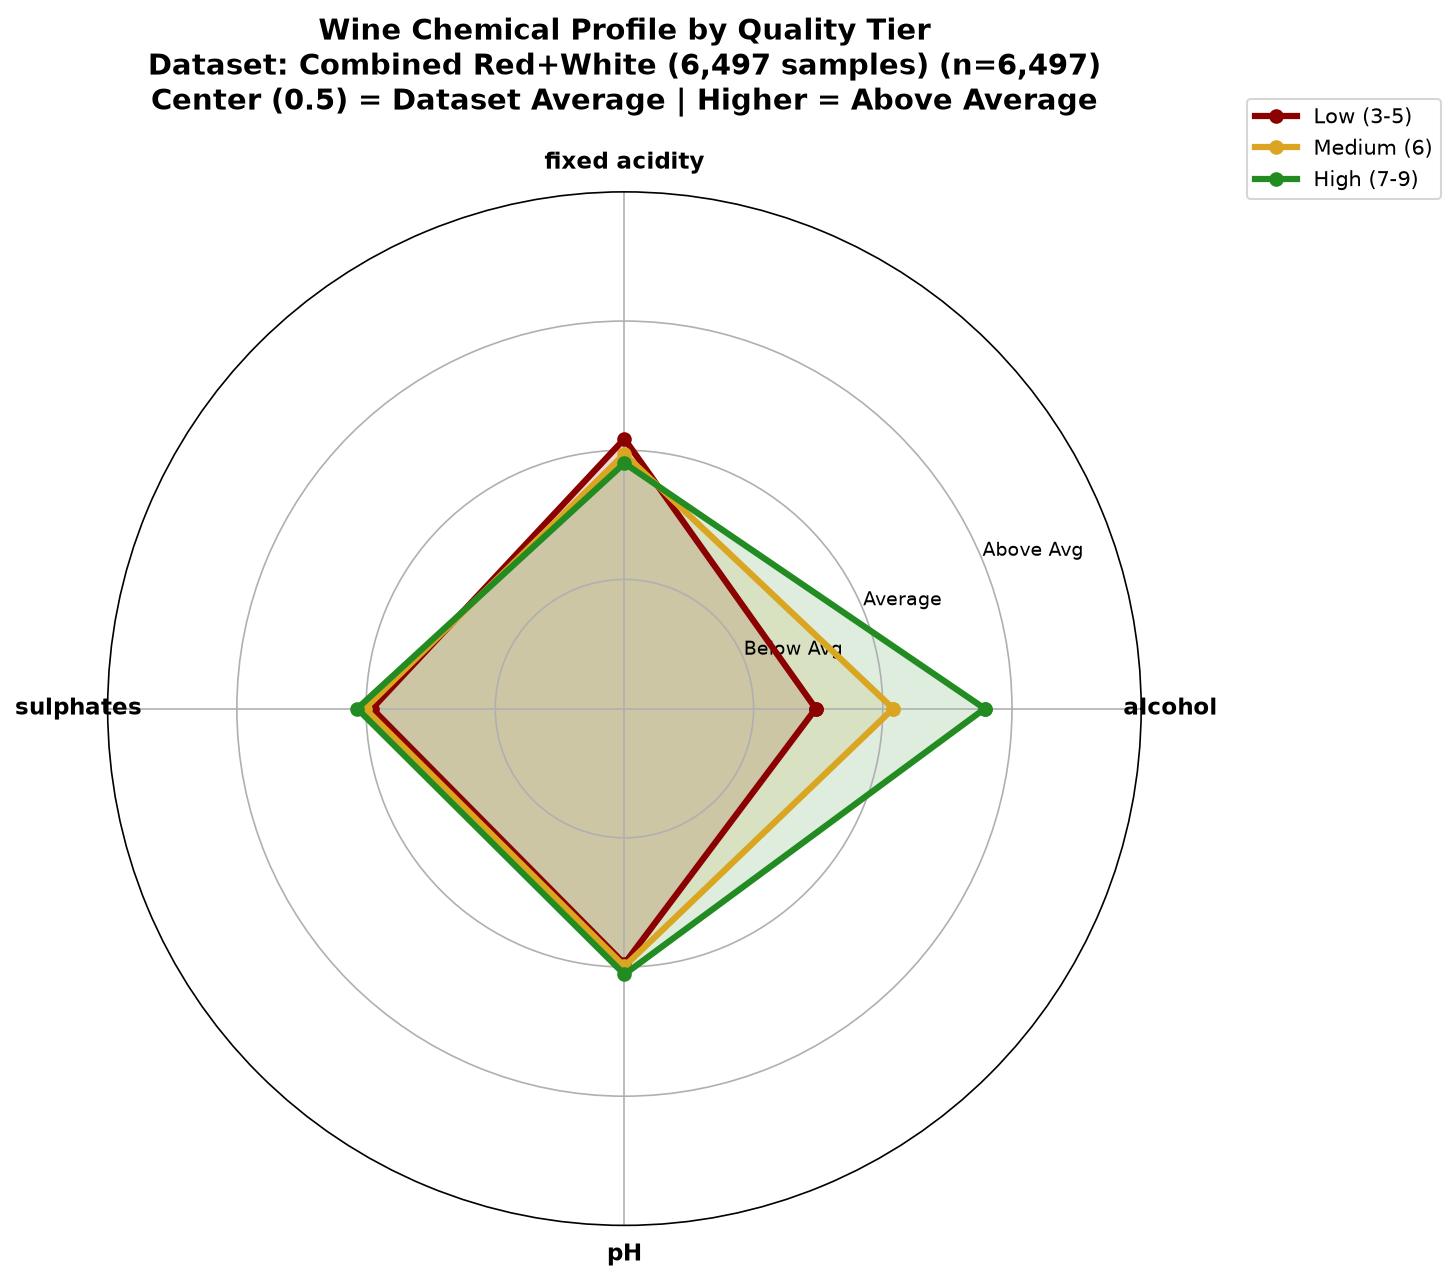
- Good wines have a recognisable chemical fingerprint: more alcohol (11.4% vs 10.3% on average), less volatile acidity (vinegar), lower density and fewer chlorides. Alcohol alone is almost a full standard deviation higher.
- A three-question decision tree already finds 79% of good wines — the rules are simple enough to read off a chart (section 02).
- Chemistry explains part of quality, not most of it. The best of six benchmarked models — a stacking ensemble — names the exact 0–10 score 69% of the time on held-out wines (baseline 44%) and is off by 0.35 points on average. Within ±1 point it is right 97% of the time.
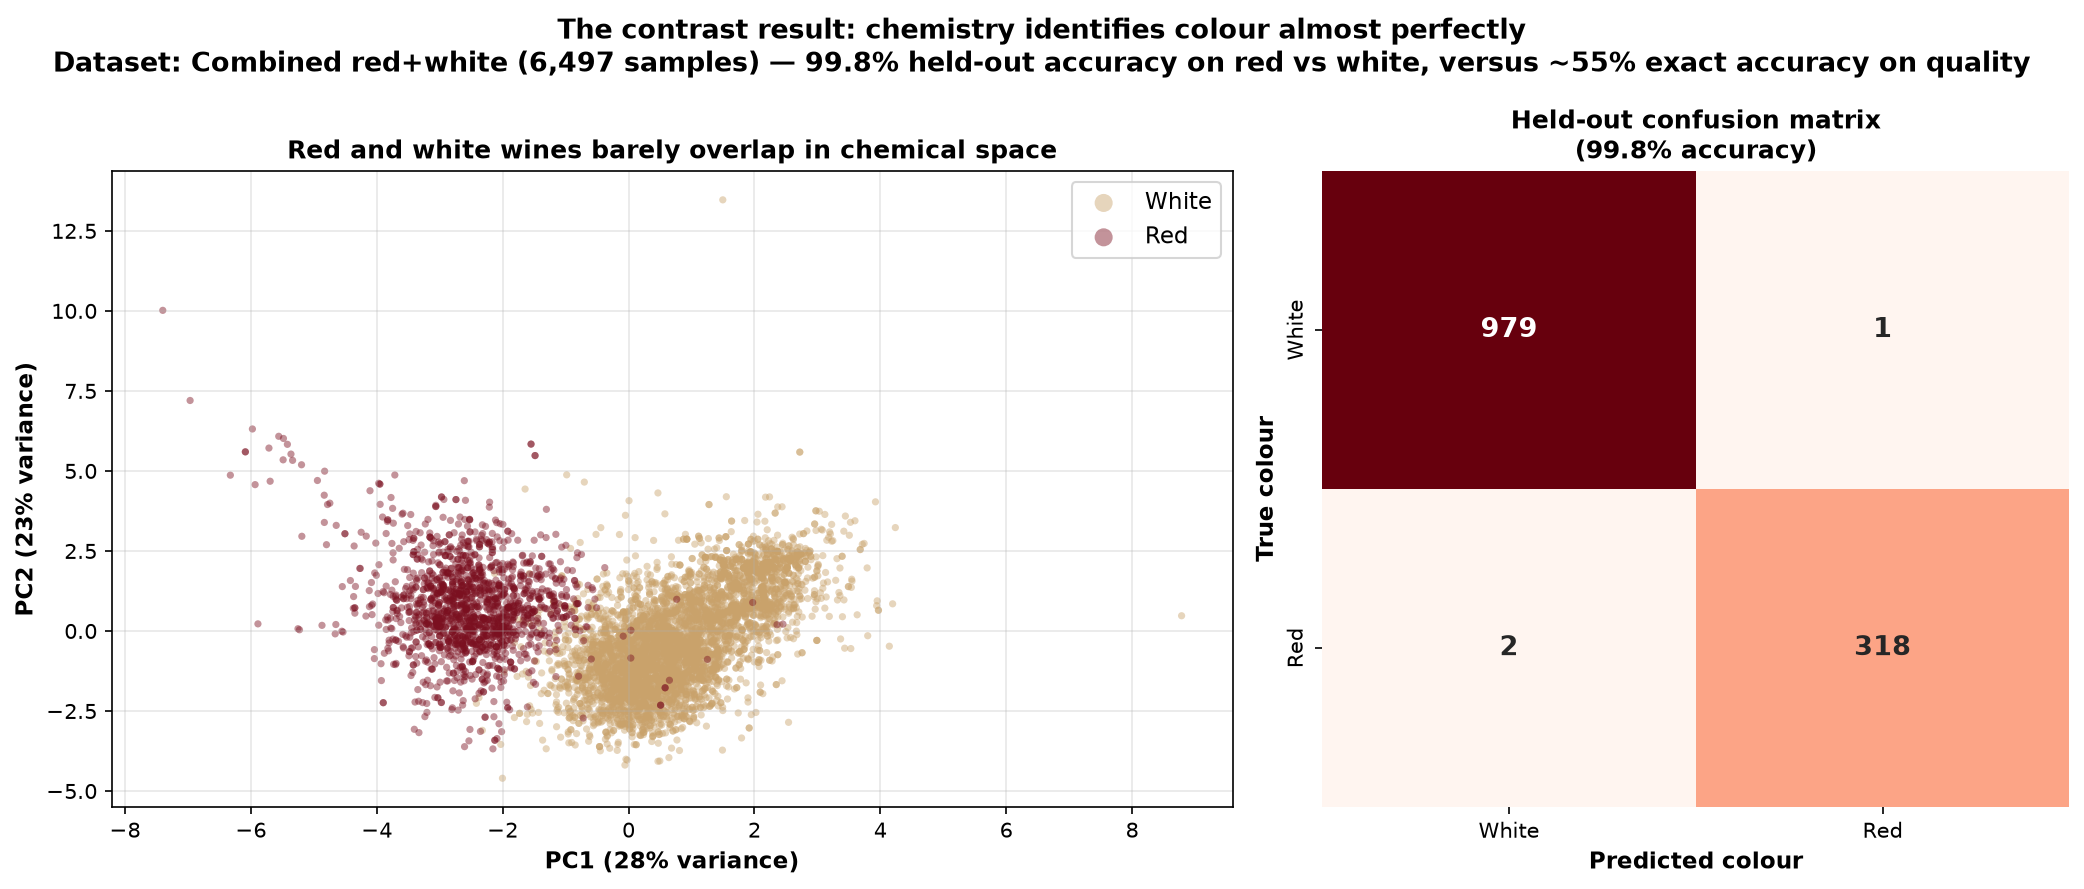
- The modest ceiling is a property of the target, not the data: the same eleven measurements identify a wine's colour with 99.8% accuracy. Colour is written into the chemistry; quality largely is not.
- Spotting good wines (quality ≥ 7) works at high precision: when the model flags a wine as good it is right 84% of the time — but it finds only 57% of them.
On methodology — why these numbers are trustworthy
Every accuracy figure here is measured on a held-out test set the model never saw during training, compared against a majority-class baseline, and the headline model is cross-checked with 5-fold cross-validation. An earlier version of this analysis reported accuracy on the training data itself (~100%) — a classic leakage trap. Feature rankings now use permutation importance on held-out data rather than the biased impurity-based scores.
02What makes a good wine — at a glance
Two deliberately simple diagrams that compress the whole study into something you can read in a minute.
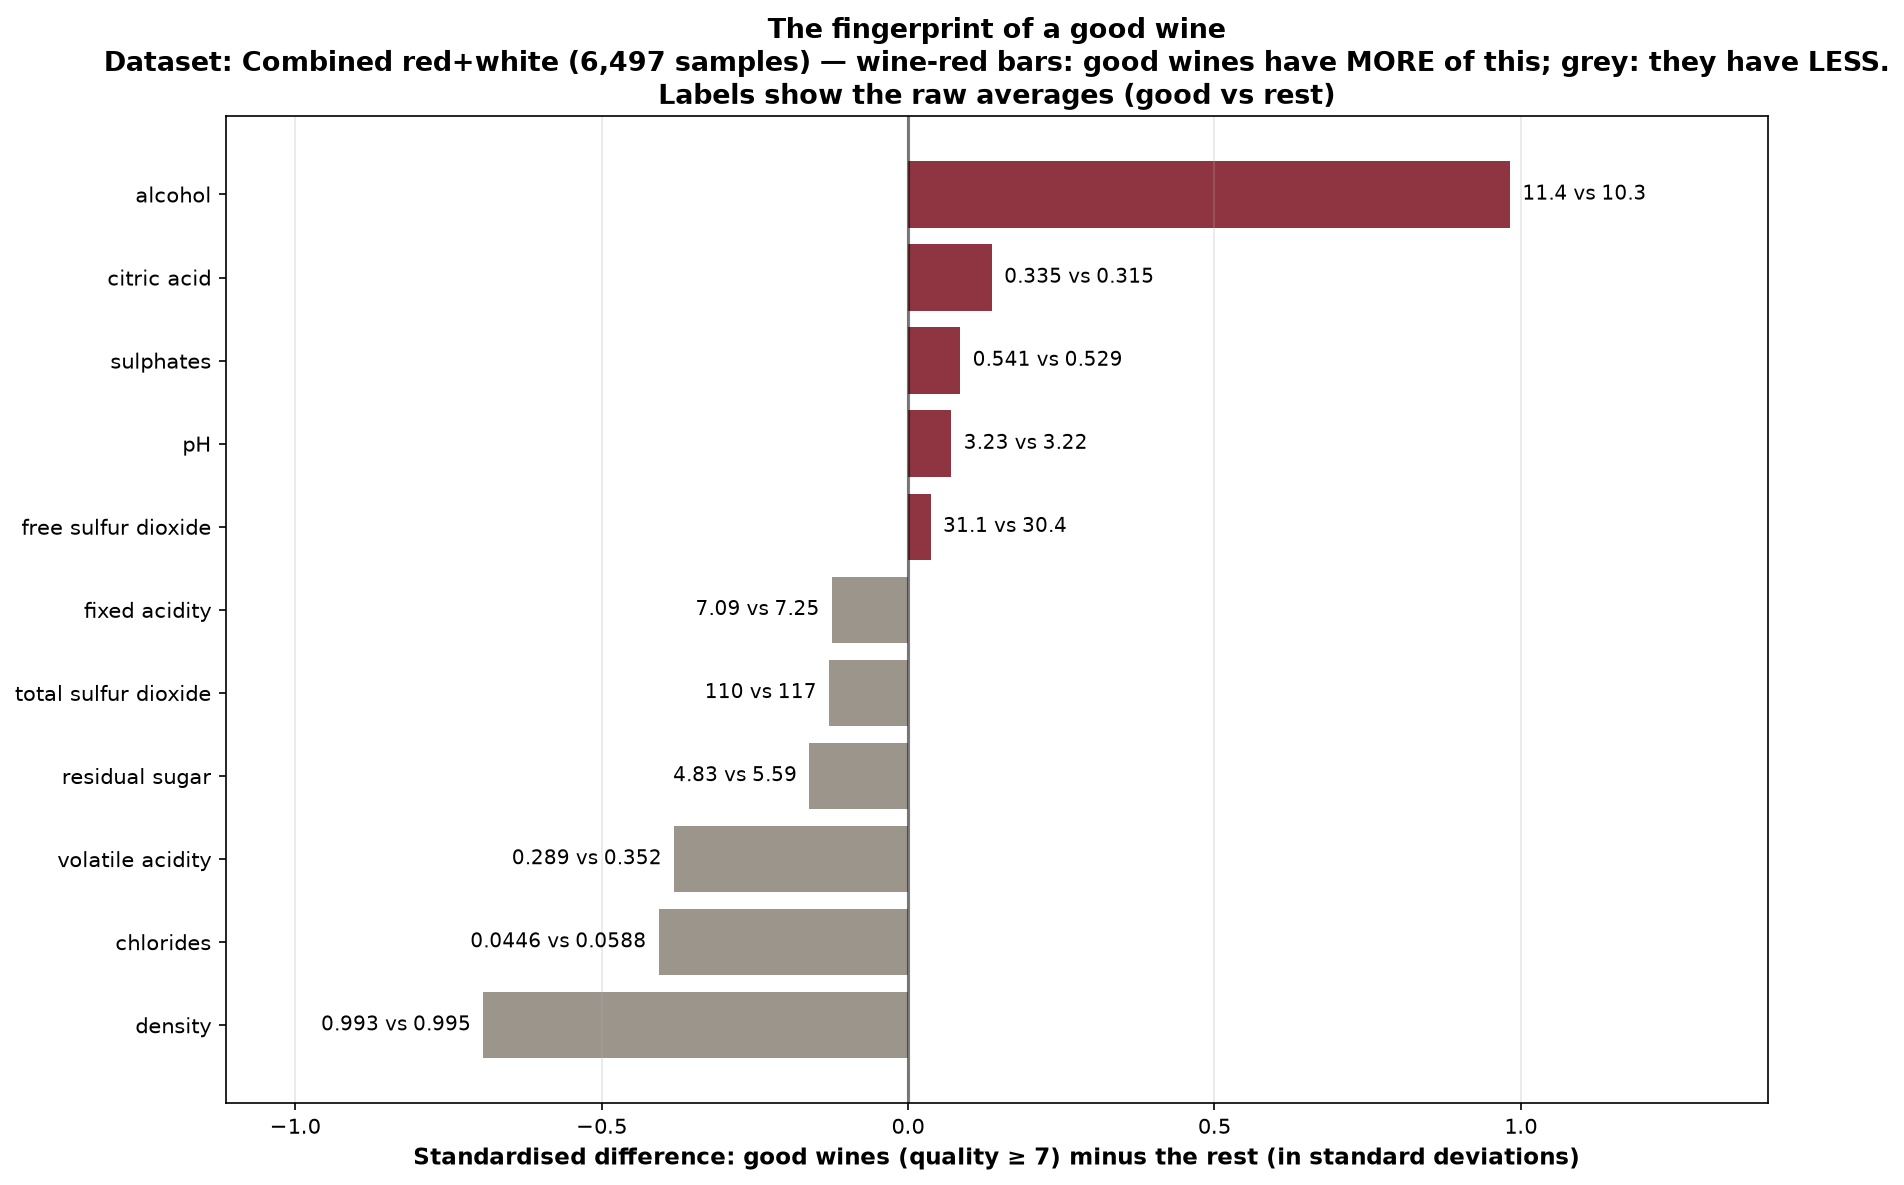
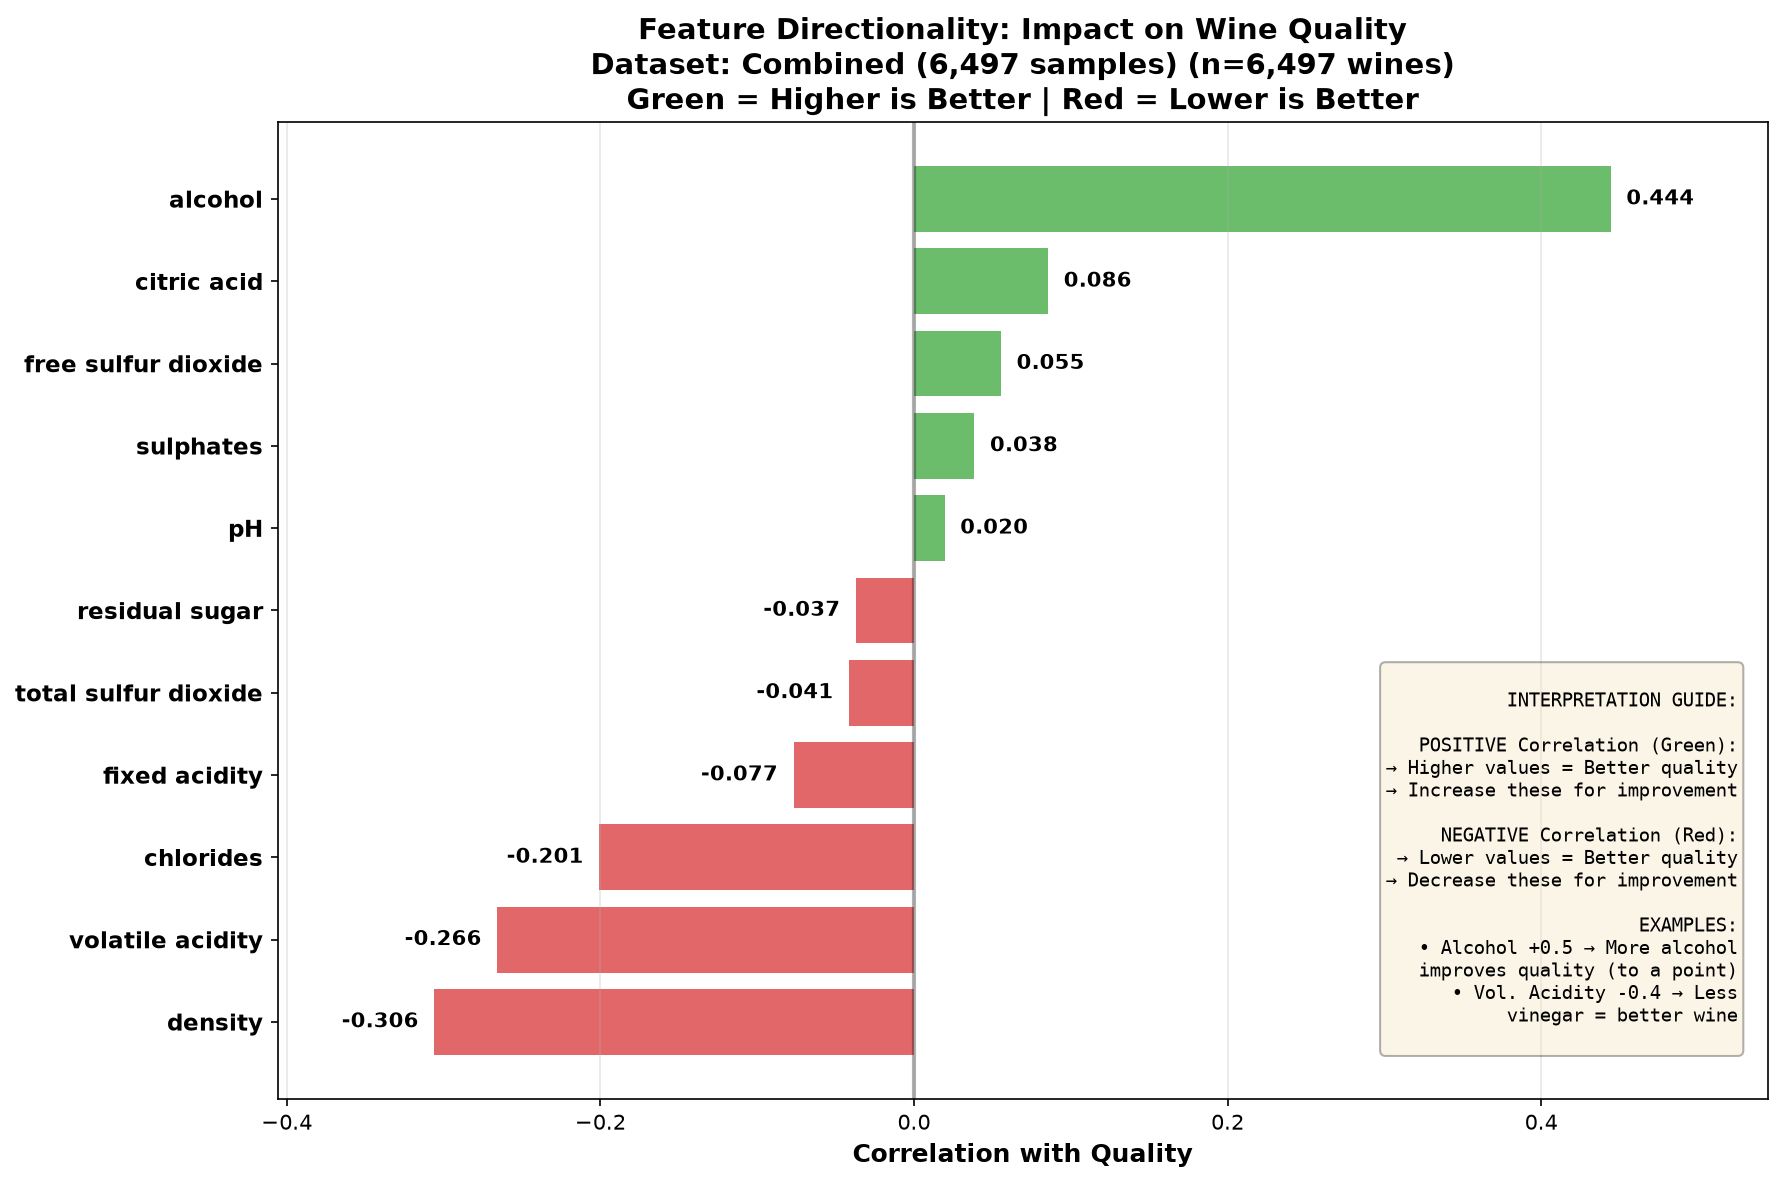
First, the fingerprint: how wines scoring 7+ differ chemically from everything else, in standard deviations. One feature dwarfs the rest — alcohol. Good wines also run cleaner (less volatile acidity), lighter (lower density) and less salty (fewer chlorides).
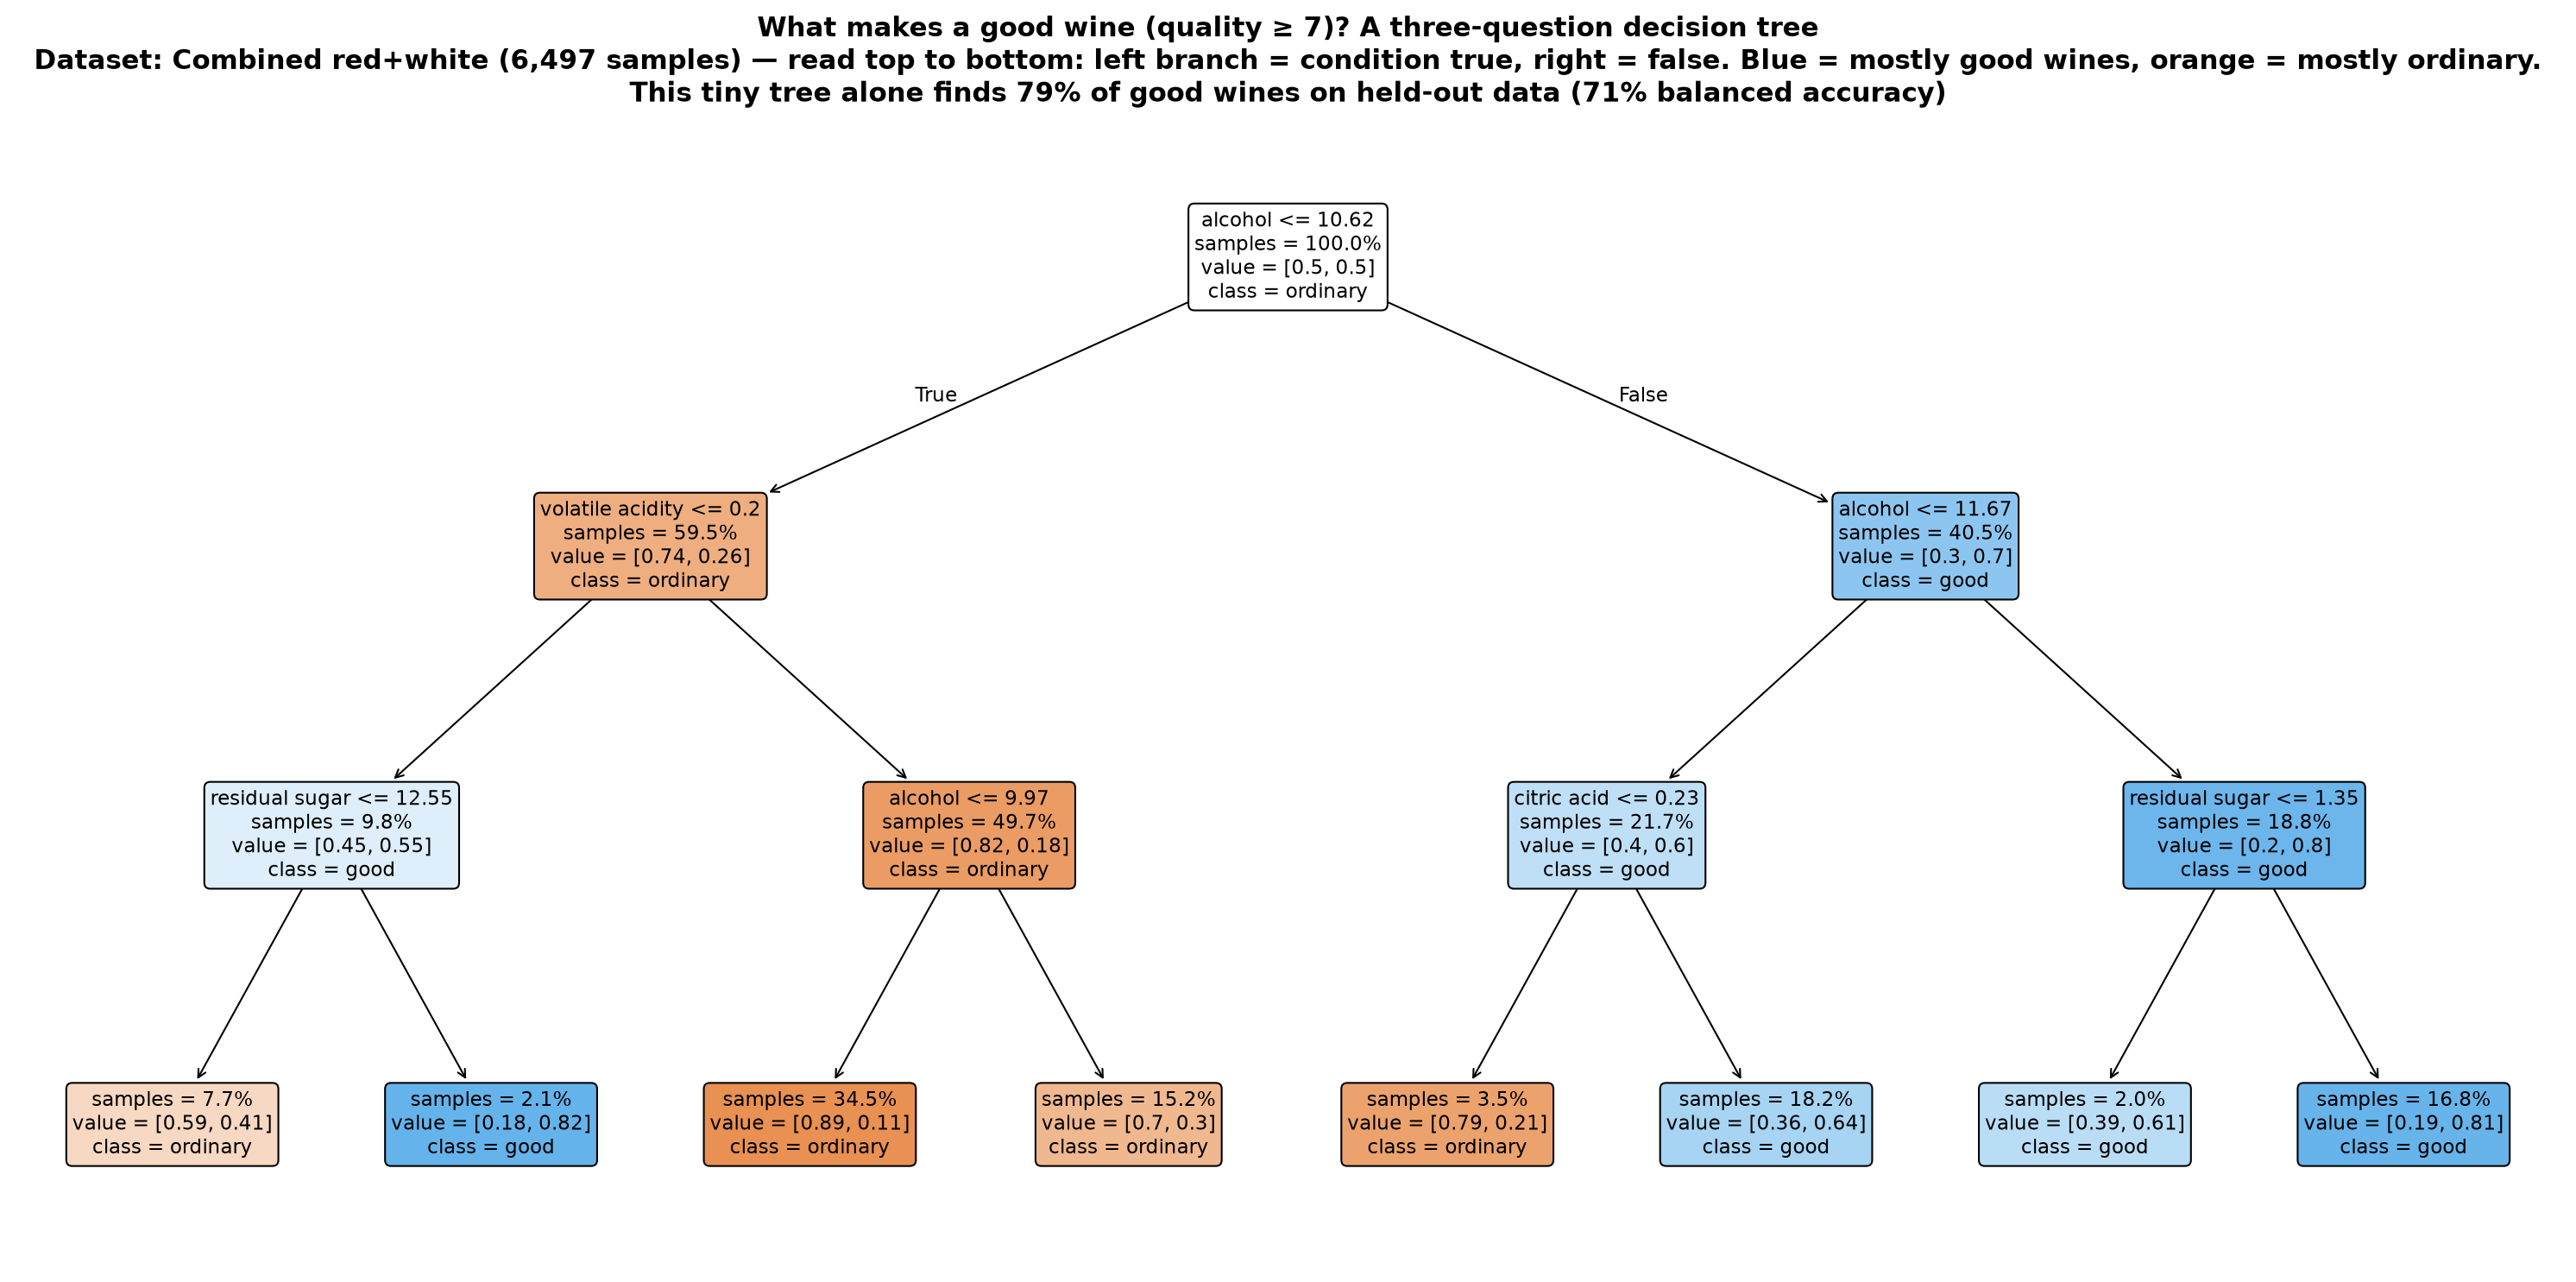
Second, a decision tree limited to three questions per wine. It's deliberately far simpler than the best model, yet it recovers 79% of good wines on held-out data. Reading the branches gives three plain-English routes to a good wine:
- The full-bodied route: alcohol above 11.7% — high-alcohol wines are good-wine territory almost regardless of the rest.
- The balanced route: alcohol 10.6–11.7% plus fresh citric acid above 0.23 g/L.
- The dessert-wine exception: low alcohol can still be good if the wine is very clean (volatile acidity ≤ 0.20 g/L) and very sweet (residual sugar > 12.6 g/L) — the sweet-white style.
Read the rules as description, not recipe
These thresholds describe finished wines that experts happened to score highly — they are not winemaking instructions. Alcohol is a downstream marker of ripe fruit and fuller style; adding it doesn't add quality.
03The data
Four public datasets, deliberately complementary: precise lab chemistry on smaller samples, plus broad market ratings.
| Dataset | Samples | What it adds |
|---|---|---|
| Red Wine Quality (Cortez et al. 2009) | 1,599 | Portuguese Vinho Verde reds; 11 chemical features + expert score |
| Wine Quality (WineQT) | 1,143 | General red set, same feature schema |
| Red & White Combined | 6,497 | 1,599 red + 4,898 white — enables red/white contrasts |
| Global Wine Ratings | 32,980 | Critic scores with region & variety (no lab chemistry) |
The chemistry datasets carry eleven measured variables — alcohol, fixed and volatile acidity, citric acid, residual sugar, chlorides, free and total SO₂, density, pH and sulphates — each paired with a 0–10 expert quality score. The ratings dataset trades chemistry for breadth and geography.
04Red vs. white
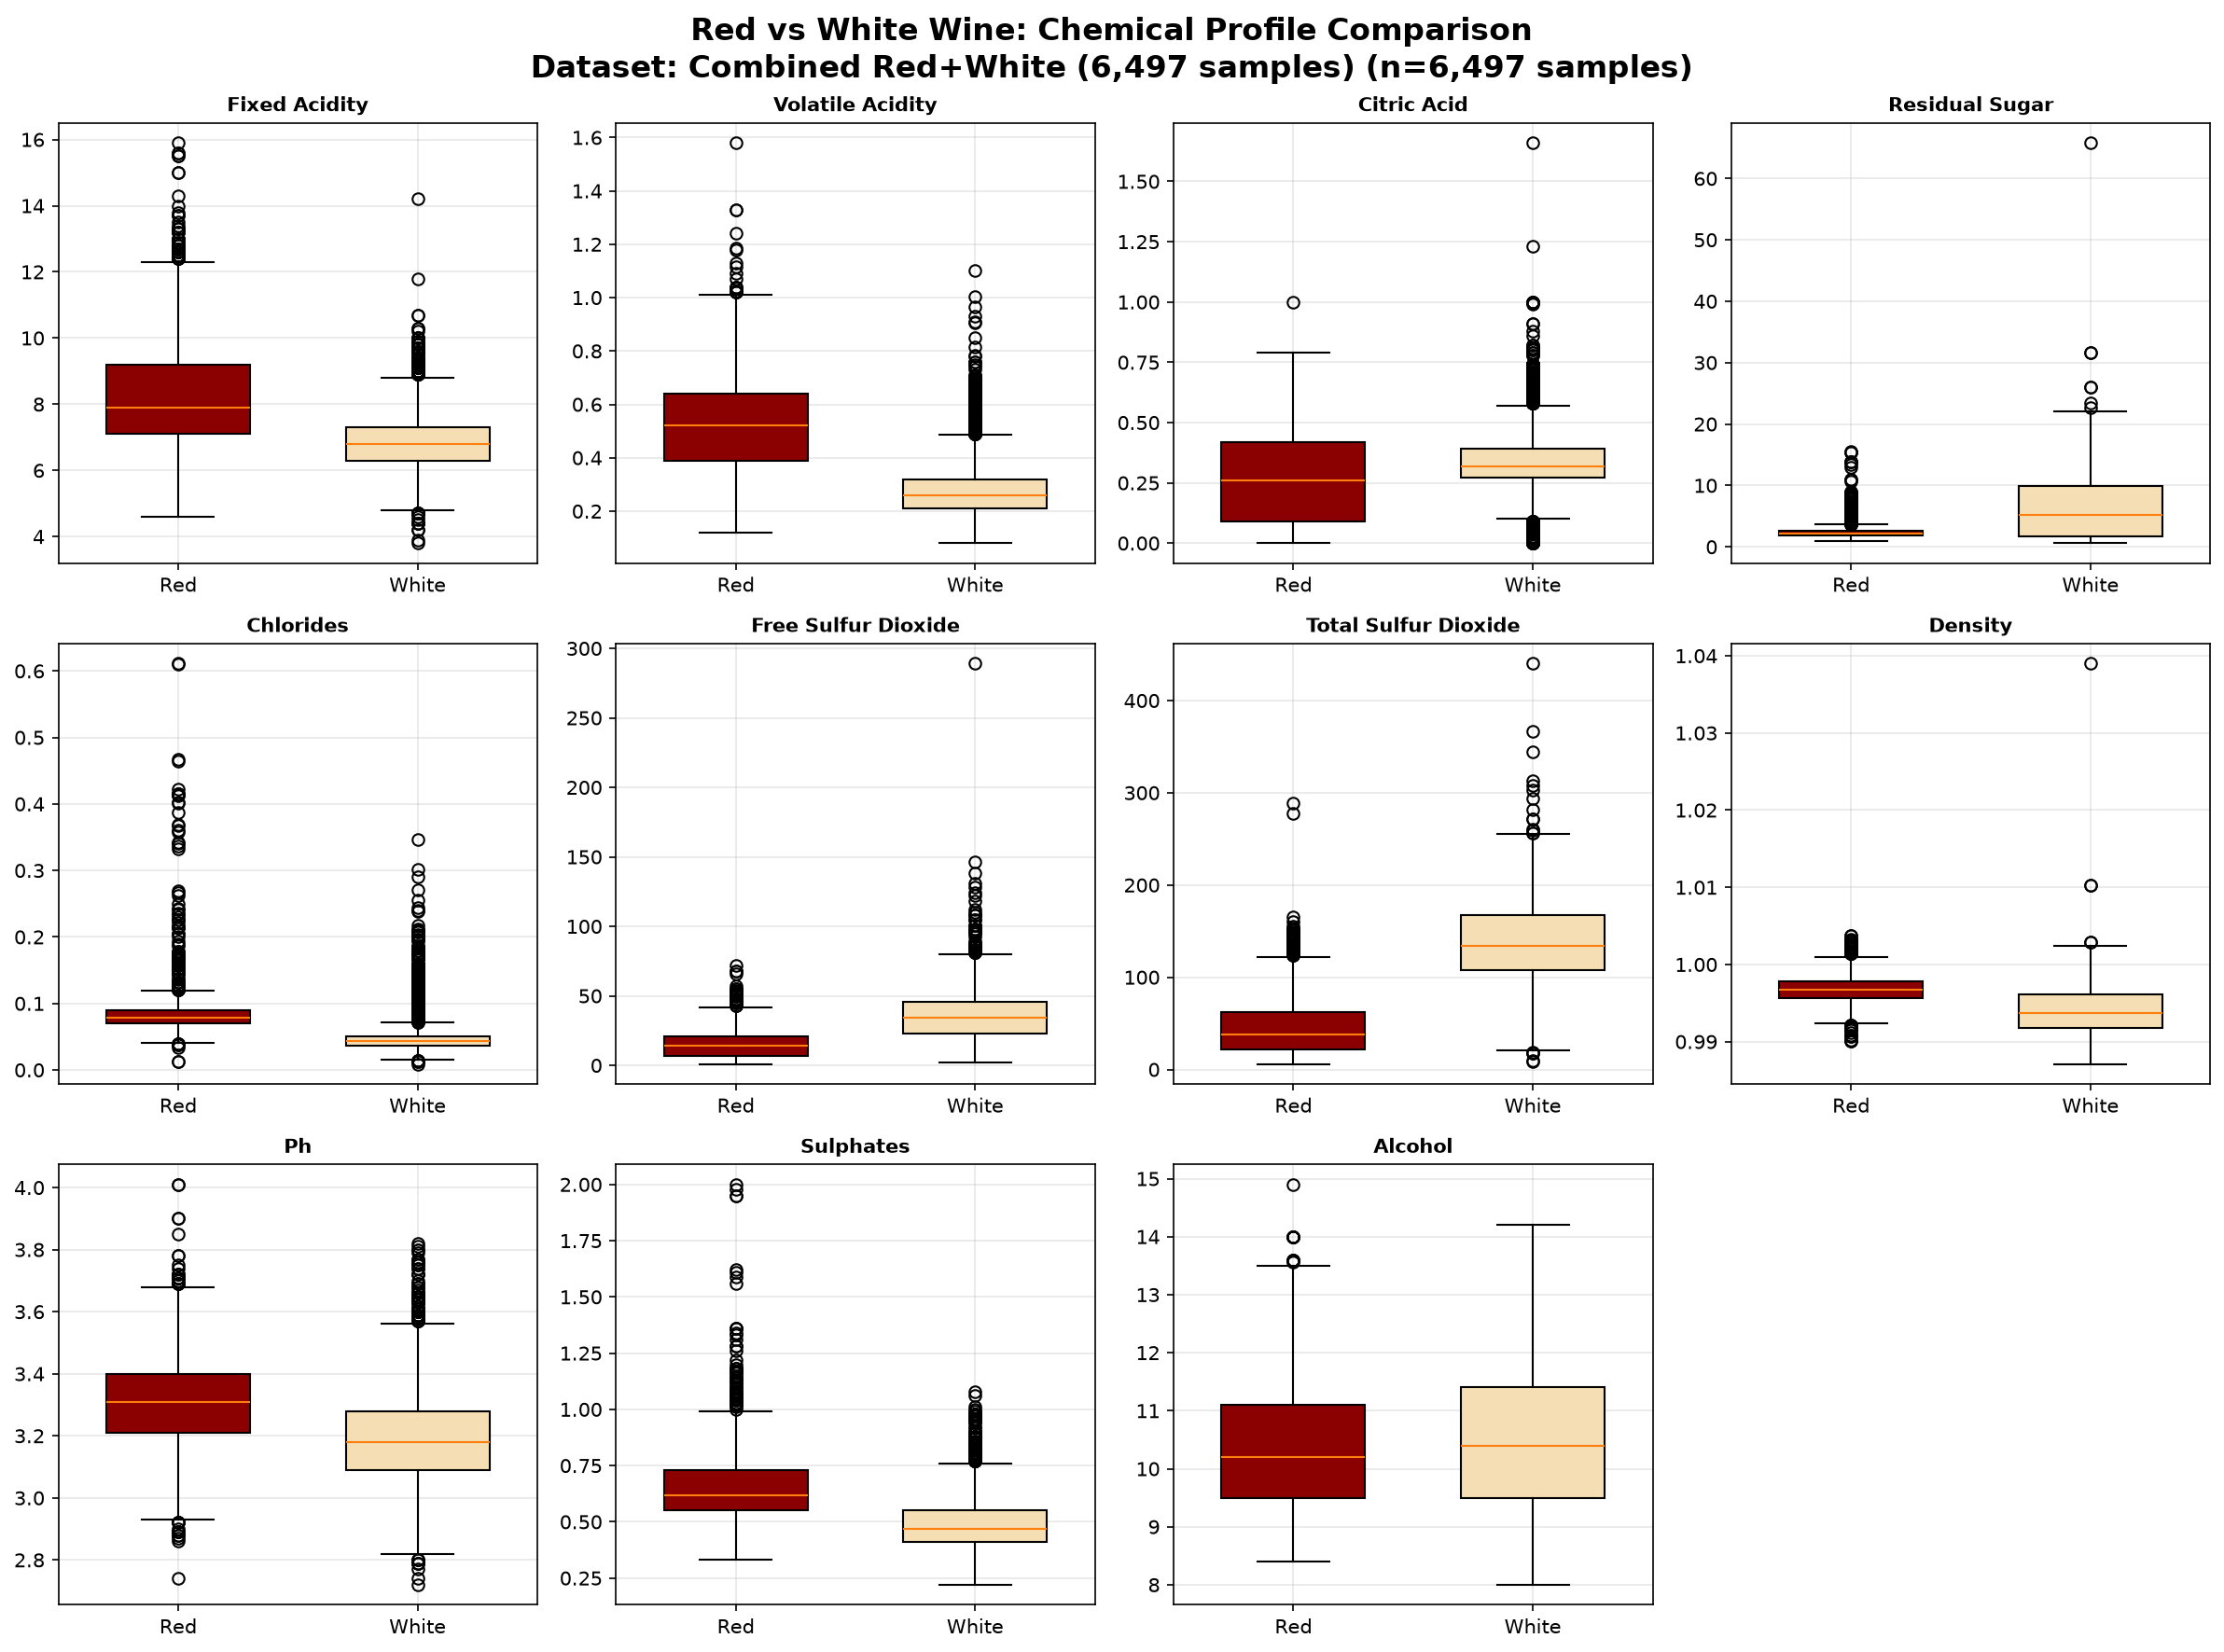
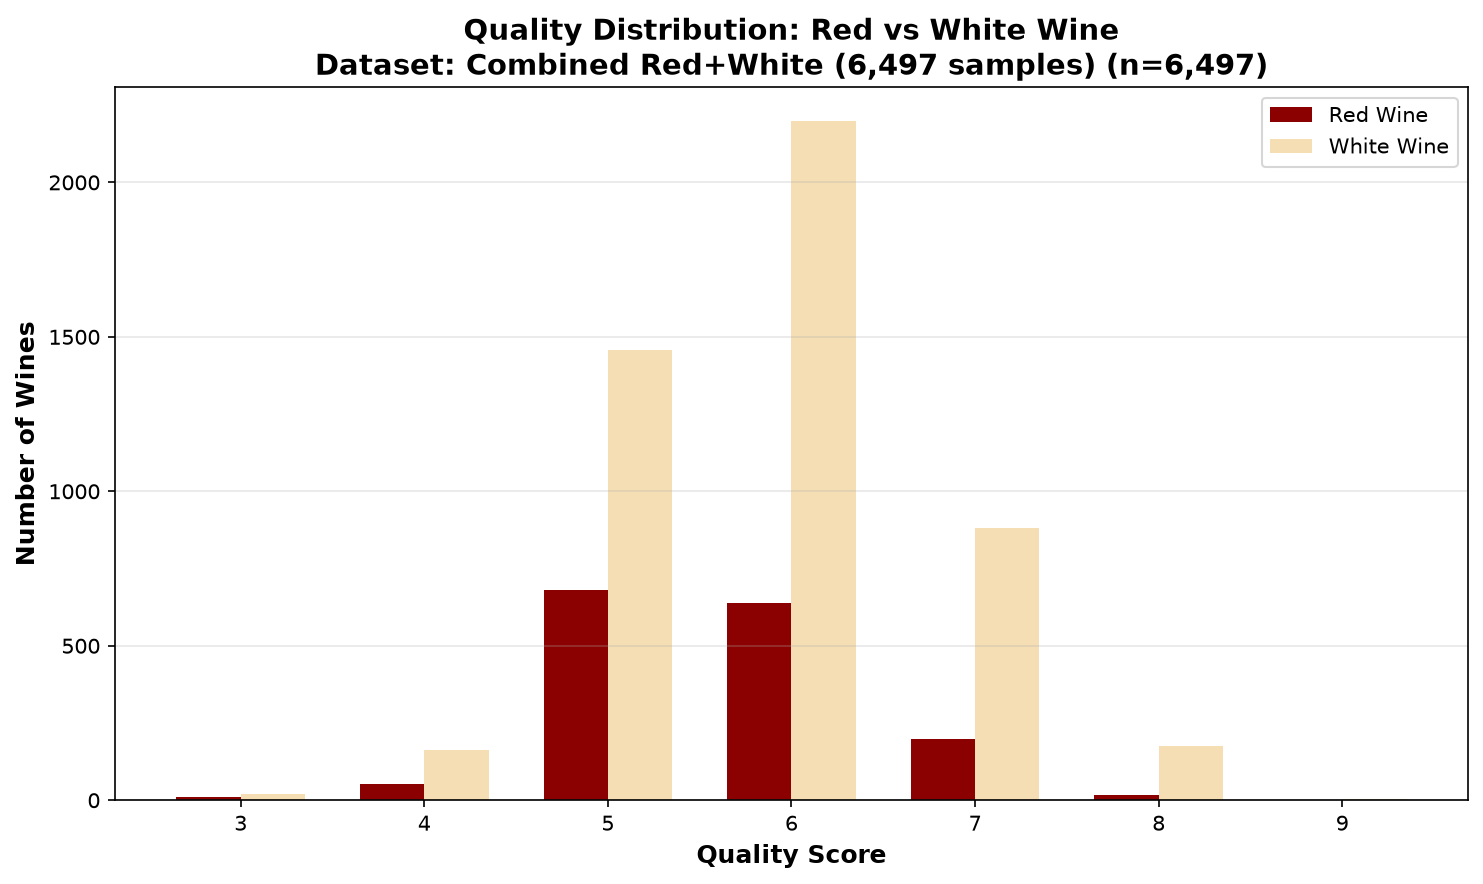
Red and white wines occupy distinctly different chemical territory. Whites carry more residual sugar and far more sulfur dioxide (preservation); reds run higher on sulphates and fixed acidity. Their quality distributions differ too — whites are more spread out, reds more concentrated in the middle.
05How chemistry relates to quality
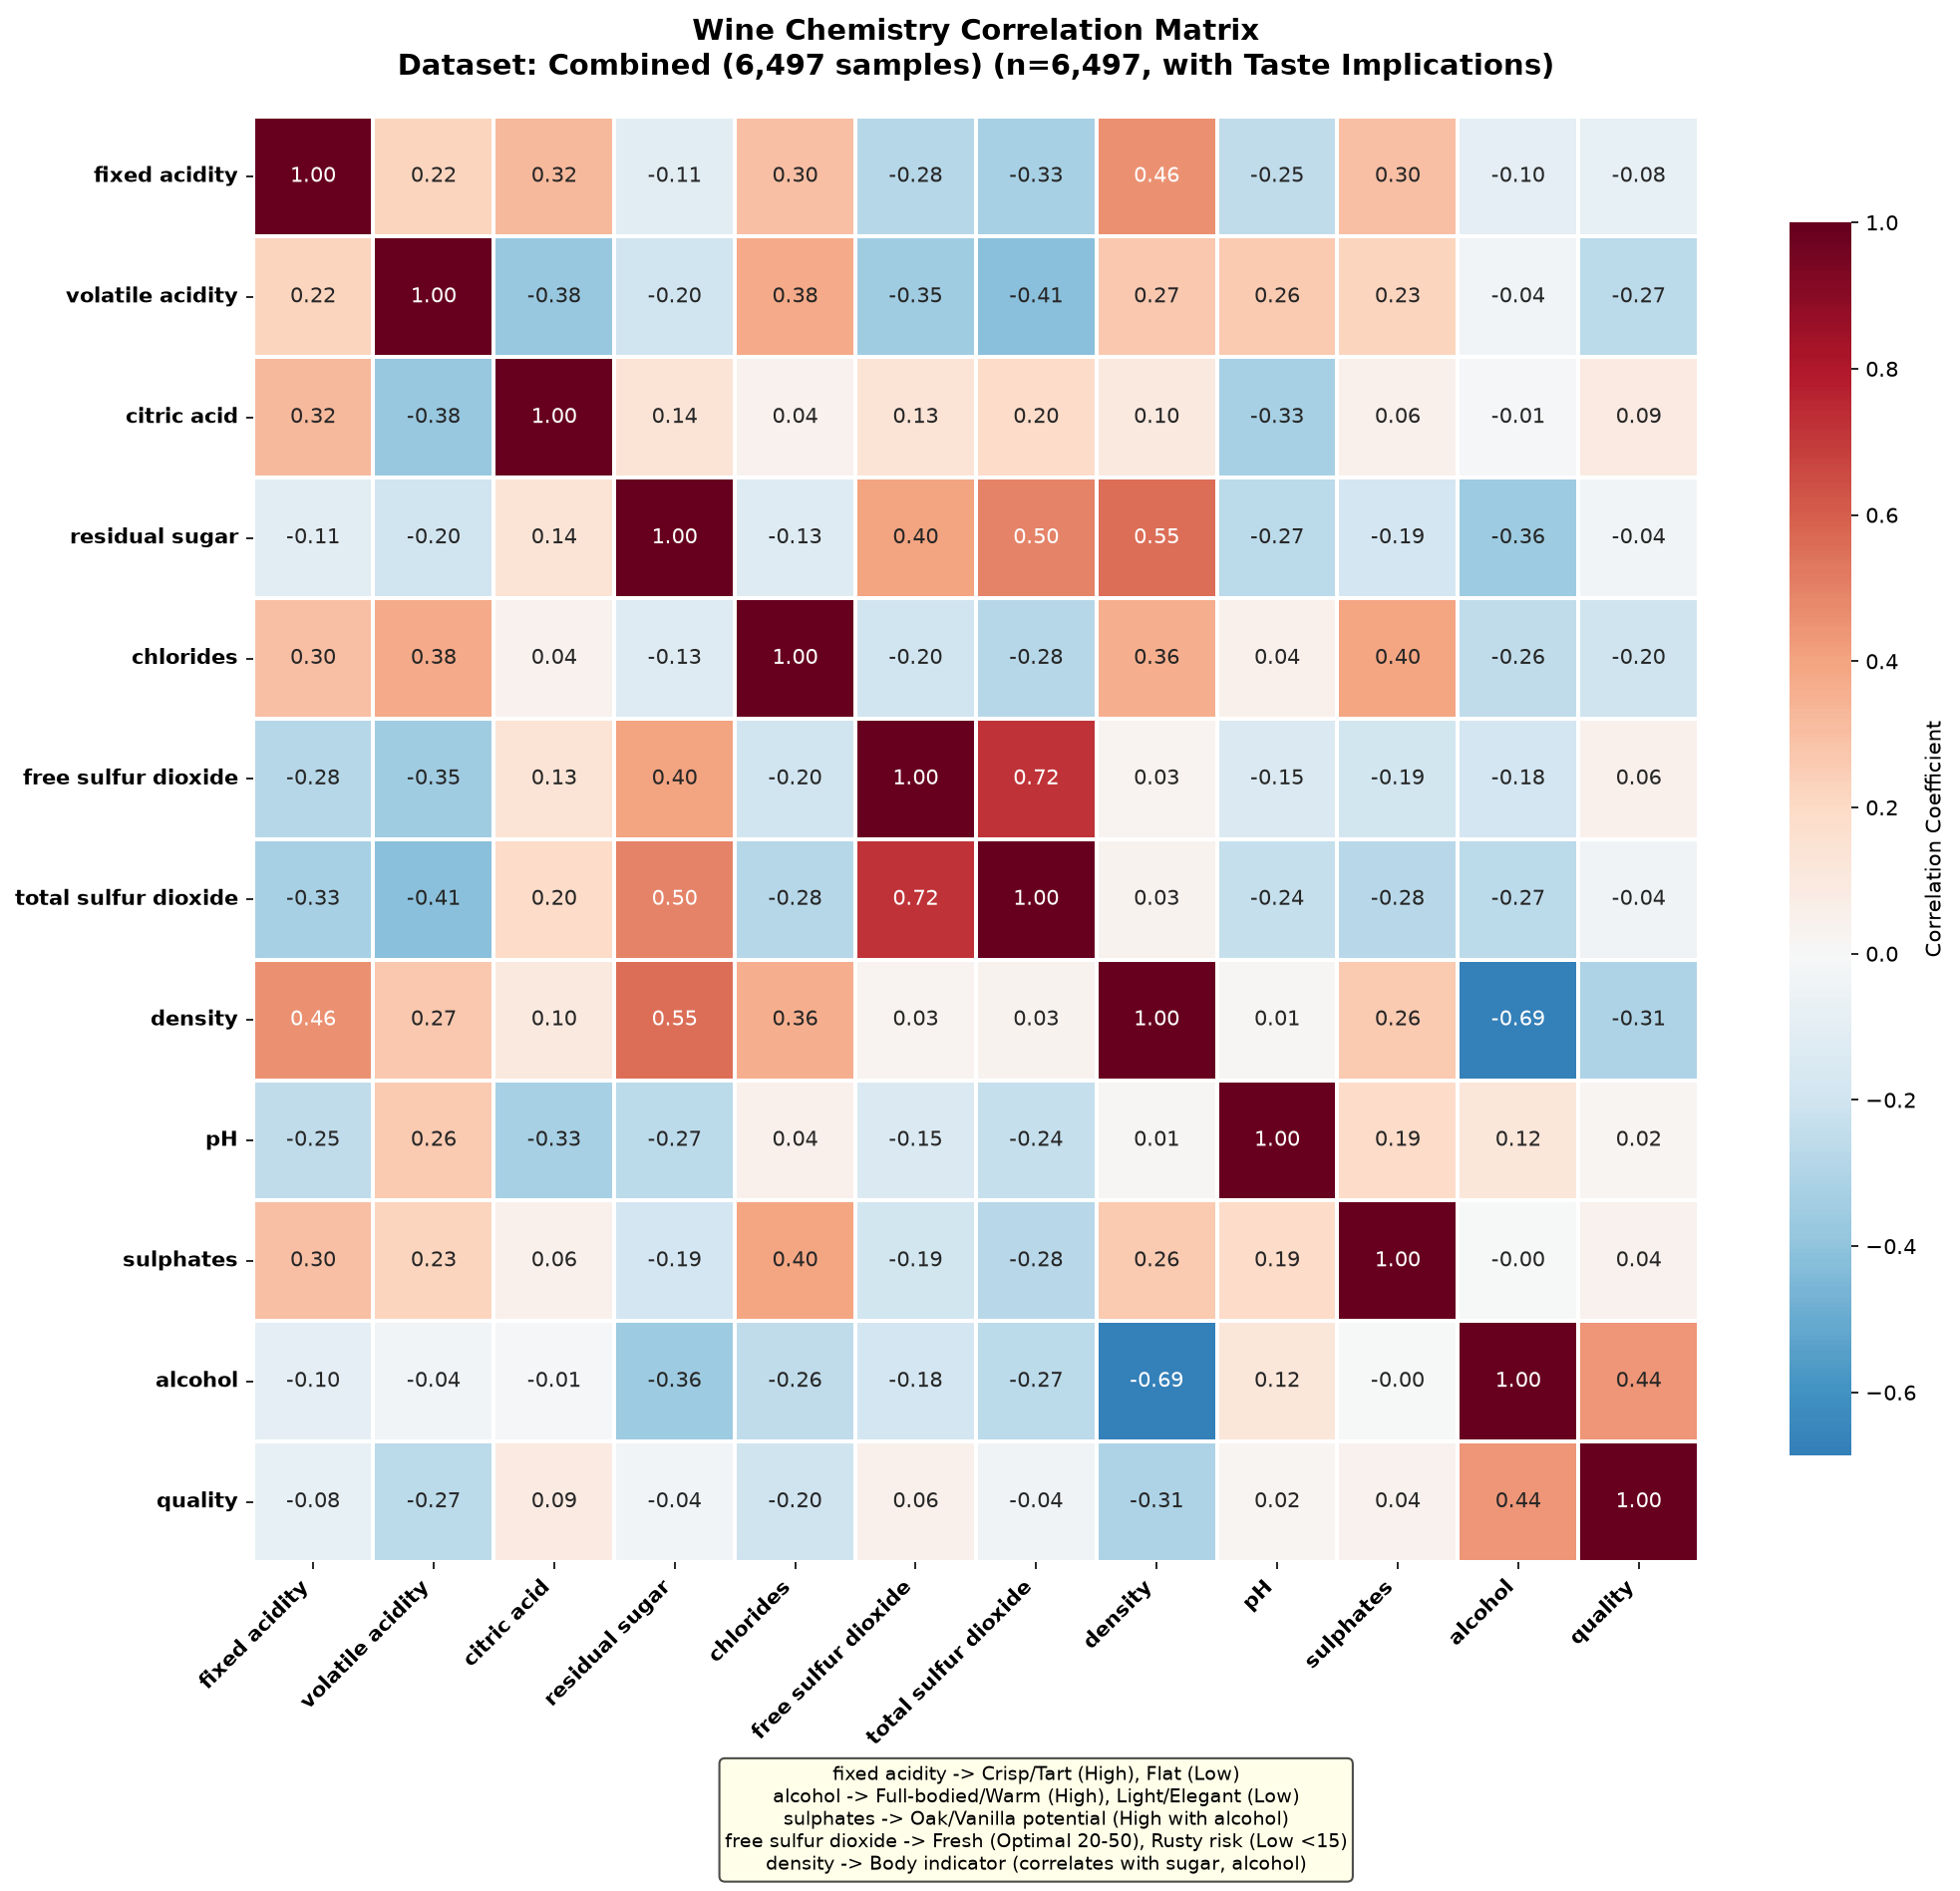
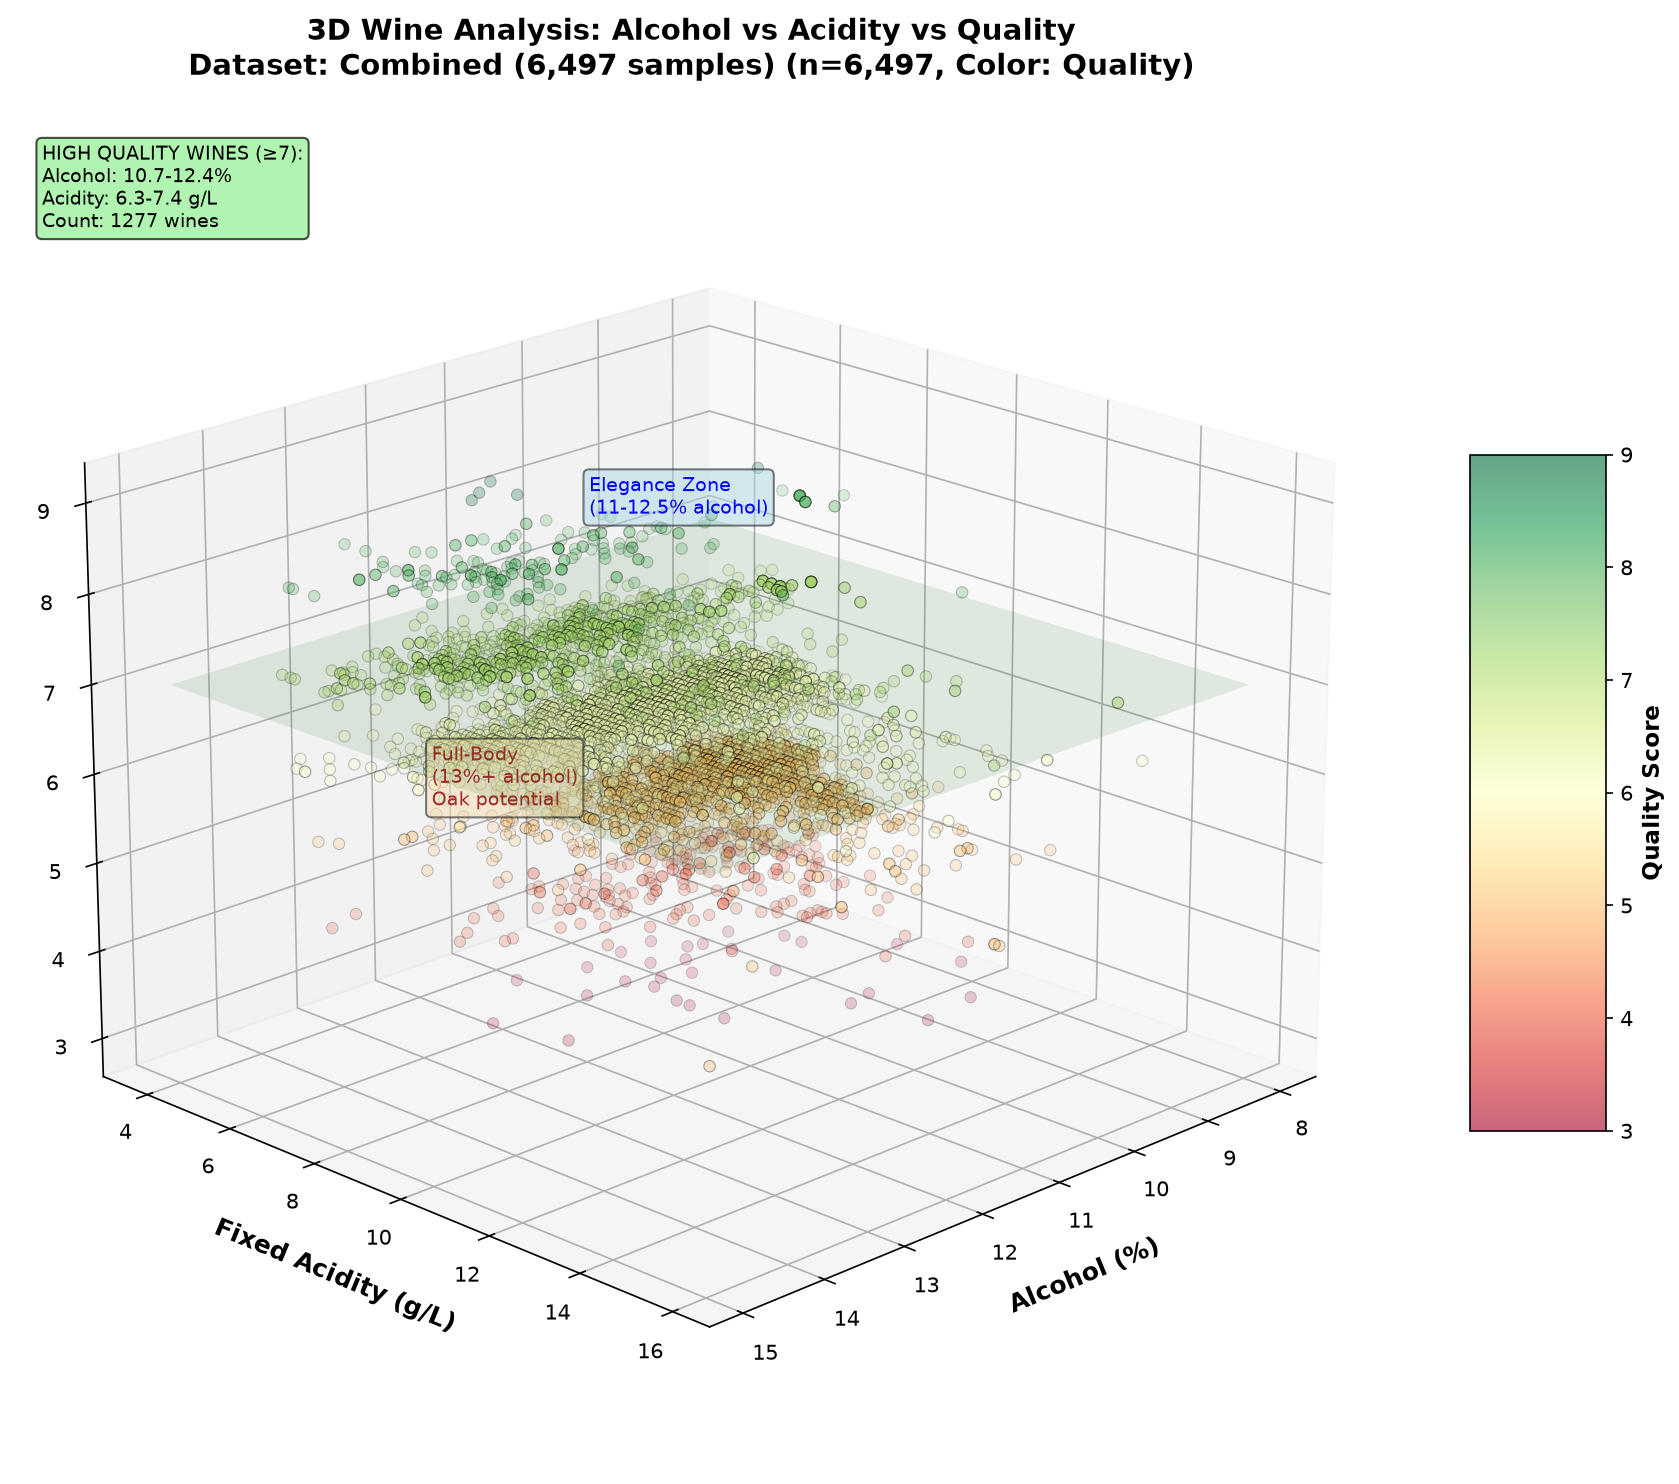
The correlation matrix is the most honest single view: alcohol shows the strongest positive association with quality (+0.48 on the red set), volatile acidity the strongest negative (−0.39). Most other variables correlate only weakly — a first hint that no single number "explains" quality.
06How good can a model actually be?
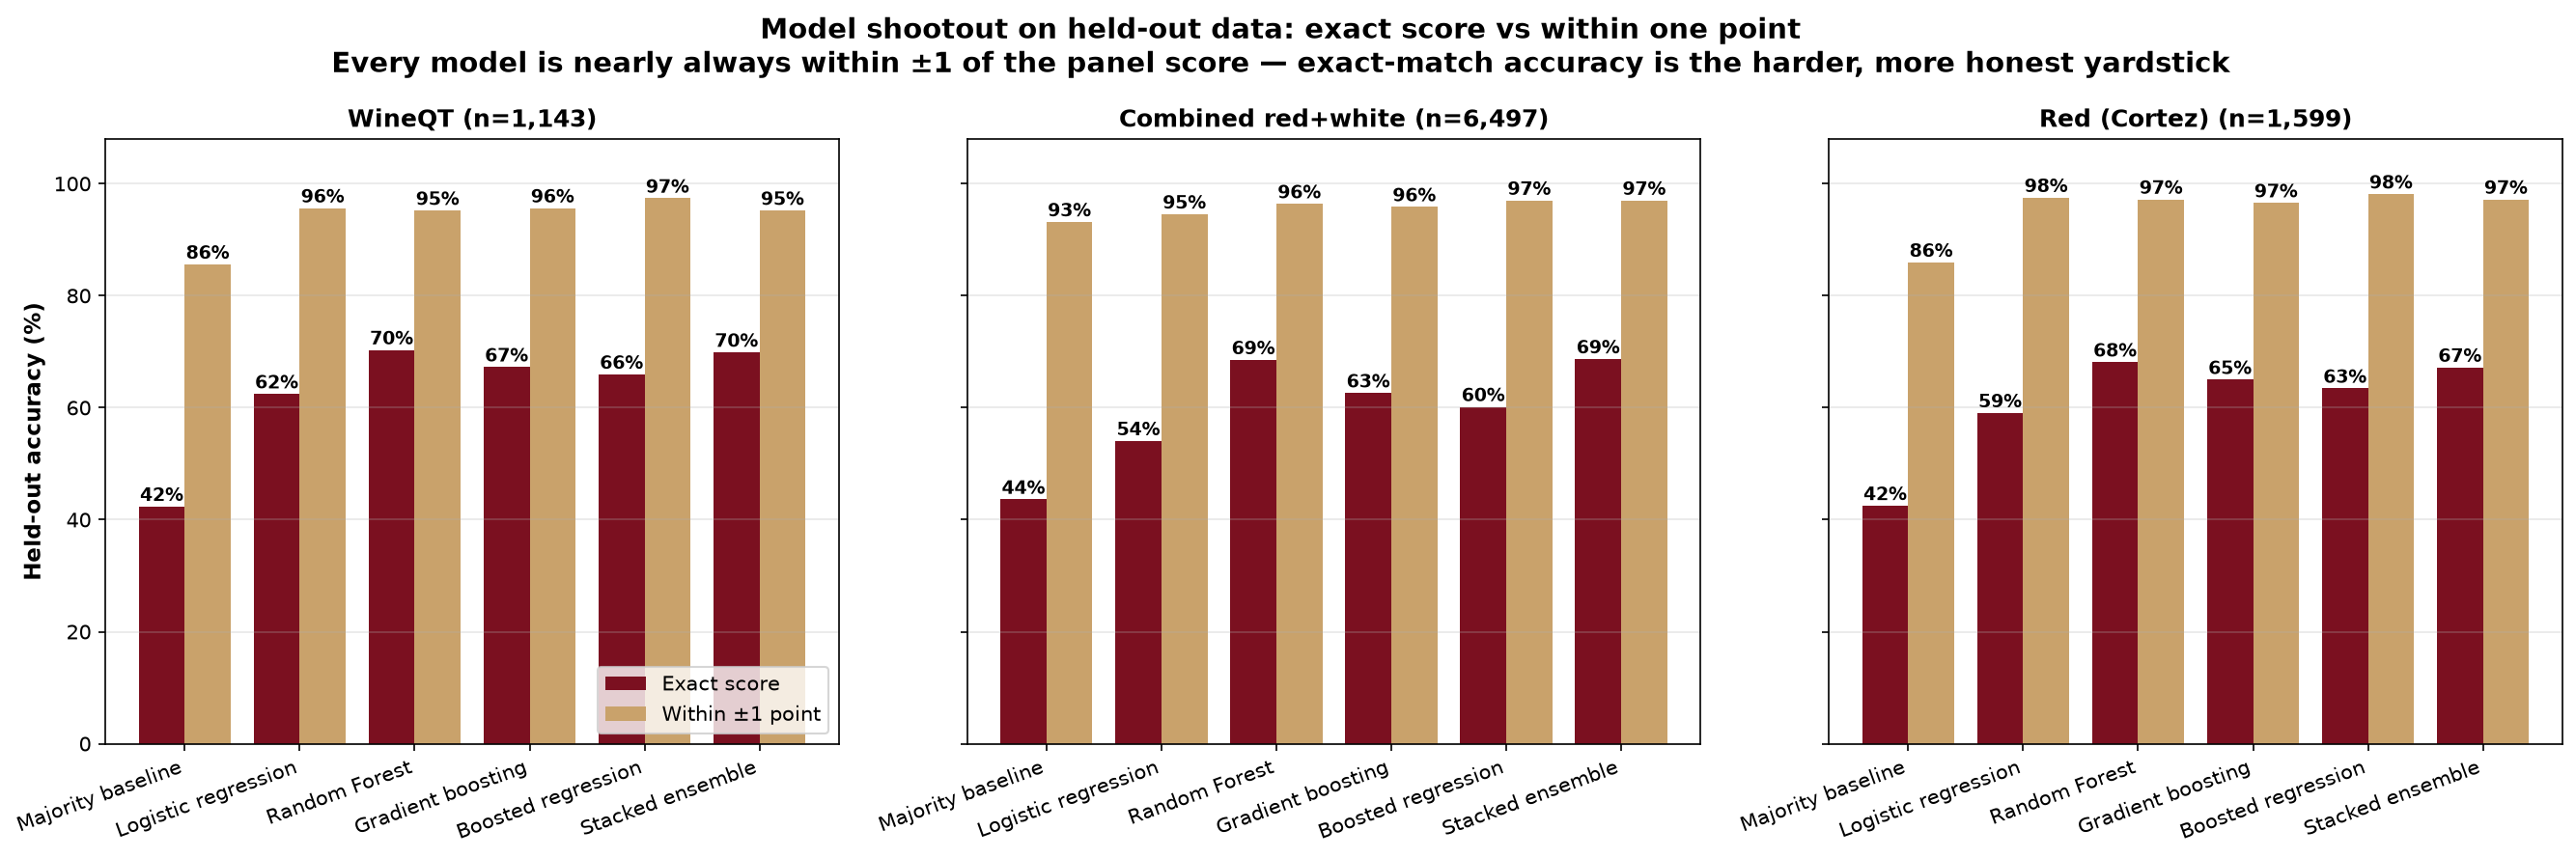
Six models compete on each dataset, all scored on a held-out 20% split: a majority-class baseline, logistic regression, a Random Forest, a tuned gradient booster, an ordinal regression-to-round model (which predicts a continuous score and rounds it, so being close is rewarded), and a stacking ensemble that blends the forest and the booster. Two yardsticks are shown — naming the exact 0–10 panel score, and landing within one point of it.
| Dataset (best model) | Exact score | Within ±1 | Avg. error | Baseline (exact) |
|---|---|---|---|---|
| Red (Cortez) · Random Forest | 68.1% | 97.2% | 0.35 pts | 42.5% |
| Combined red+white · Stacked ensemble | 68.7% | 97.0% | 0.35 pts | 43.6% |
| WineQT · Random Forest | 70.3% | 95.2% | 0.34 pts | 42.4% |
Don't let "97% within one point" oversell it
Because most wines score 5–6, even the baseline of always guessing "6" lands within one point 86–93% of the time. The honest reading: the model's real edge over naive guessing is ~25 points of exact accuracy and a halved average error — genuine signal, far from deterministic. Under 5-fold cross-validation exact accuracy sits at ~51–59%.
07Where the model fails — and which signals carry it
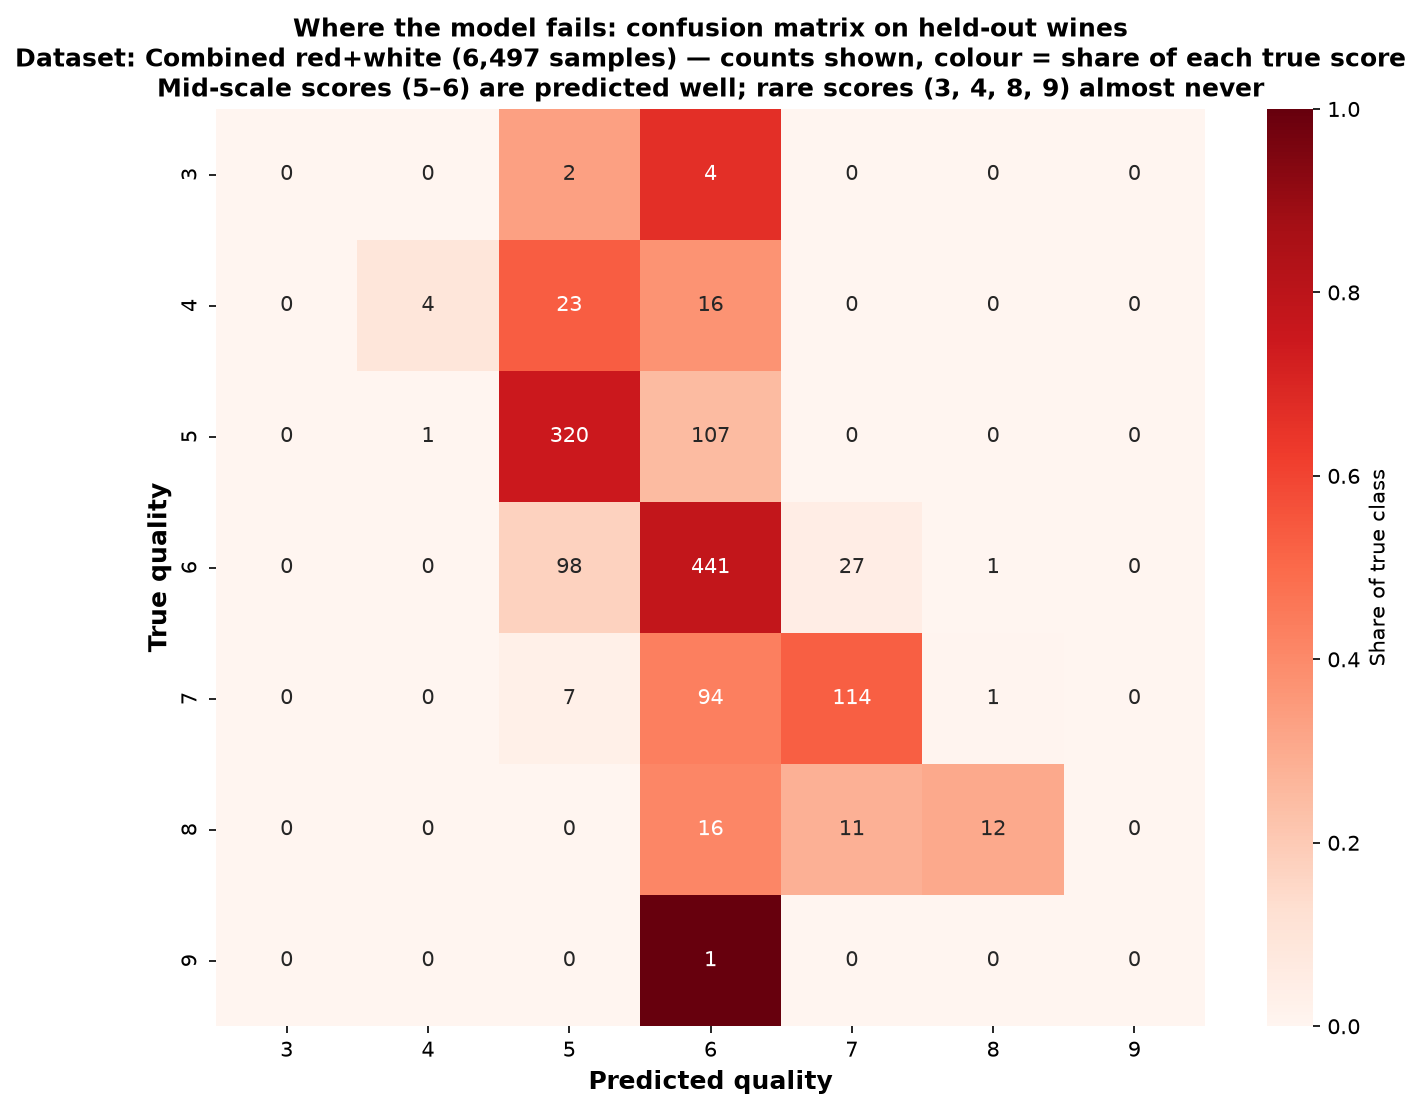
The confusion matrix shows the failure mode precisely: the model is reliable for the common scores (5–6), drifts by one point on 7s, and essentially never predicts the rare scores (3, 4, 8, 9). Any headline accuracy hides this class-imbalance cost.
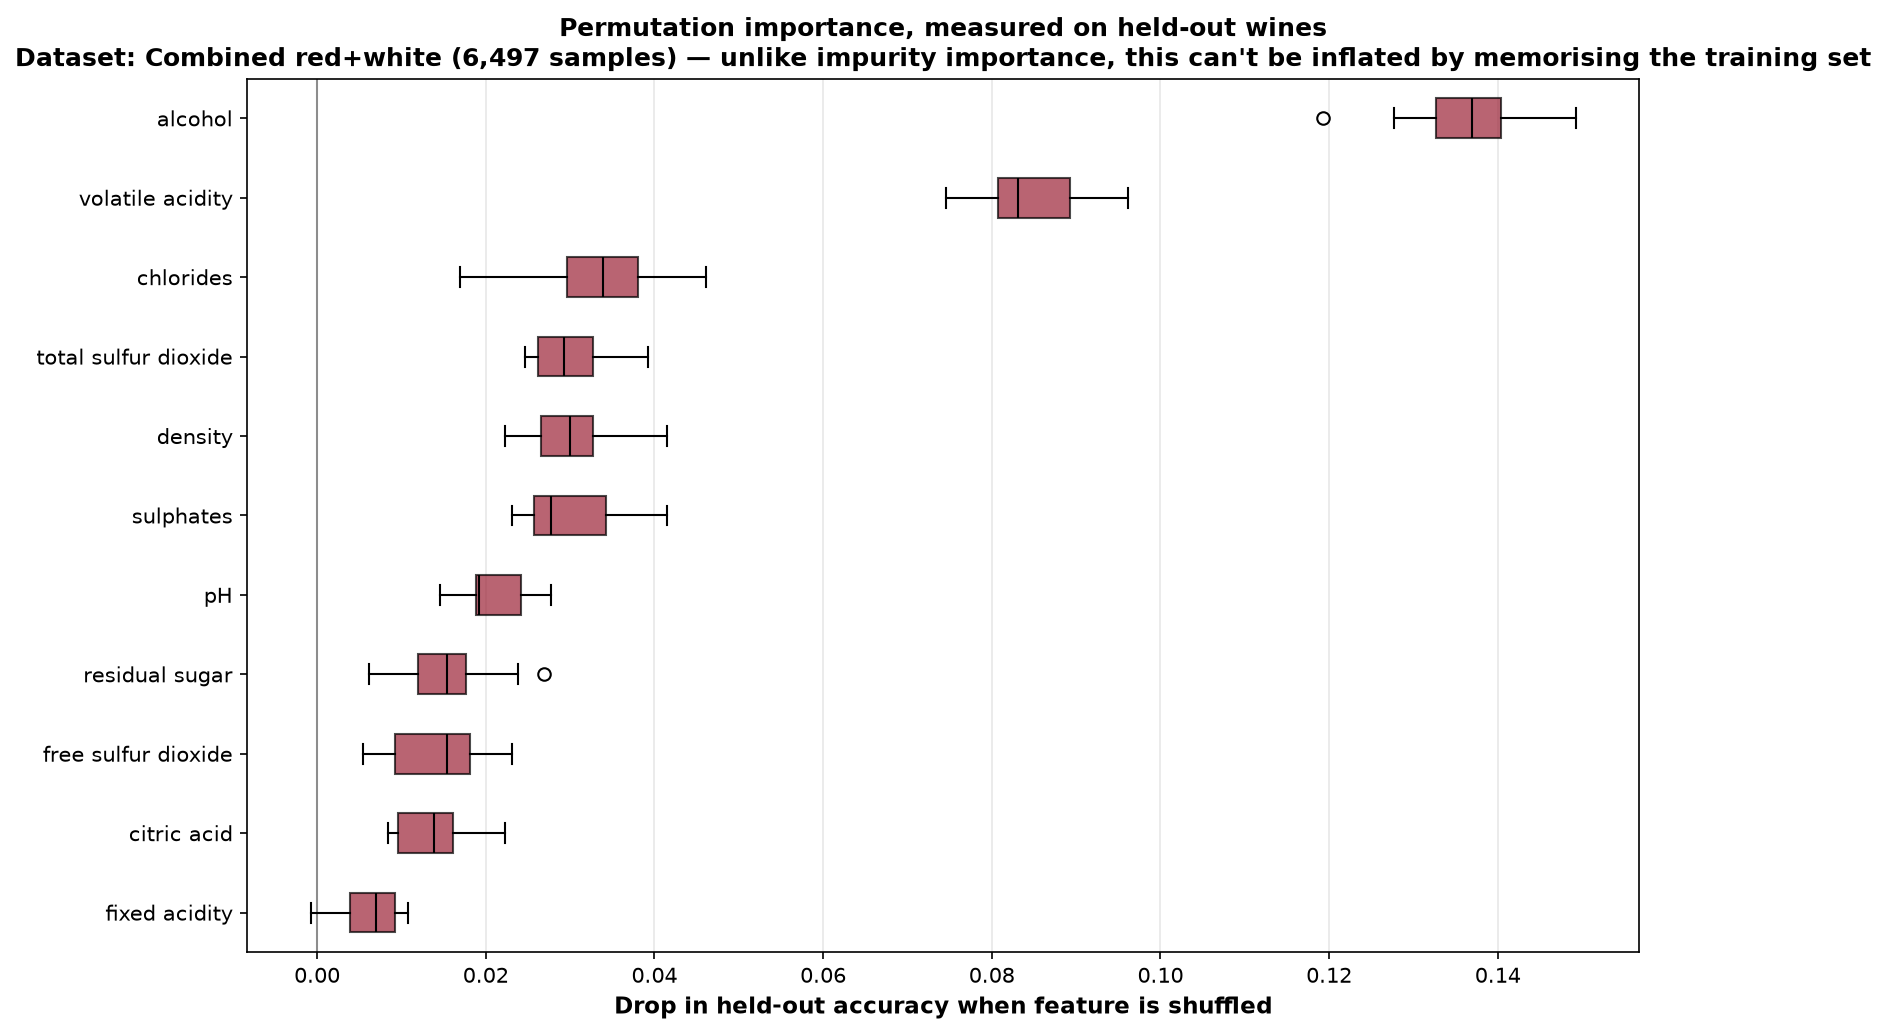
For feature rankings, this version uses permutation importance measured on held-out wines: shuffle one feature and watch accuracy drop. Unlike the impurity-based importances most analyses quote, it can't be inflated by memorising the training set. Shuffling alcohol costs the model 13.6 points of accuracy; volatile acidity 8.5; everything else under 3.5.
08Can we at least spot the good ones?
Reframed as the question a buyer actually asks — "is this wine good (7+)?" — the problem becomes binary and imbalanced: only 20% of wines qualify. Here chemistry performs genuinely well:
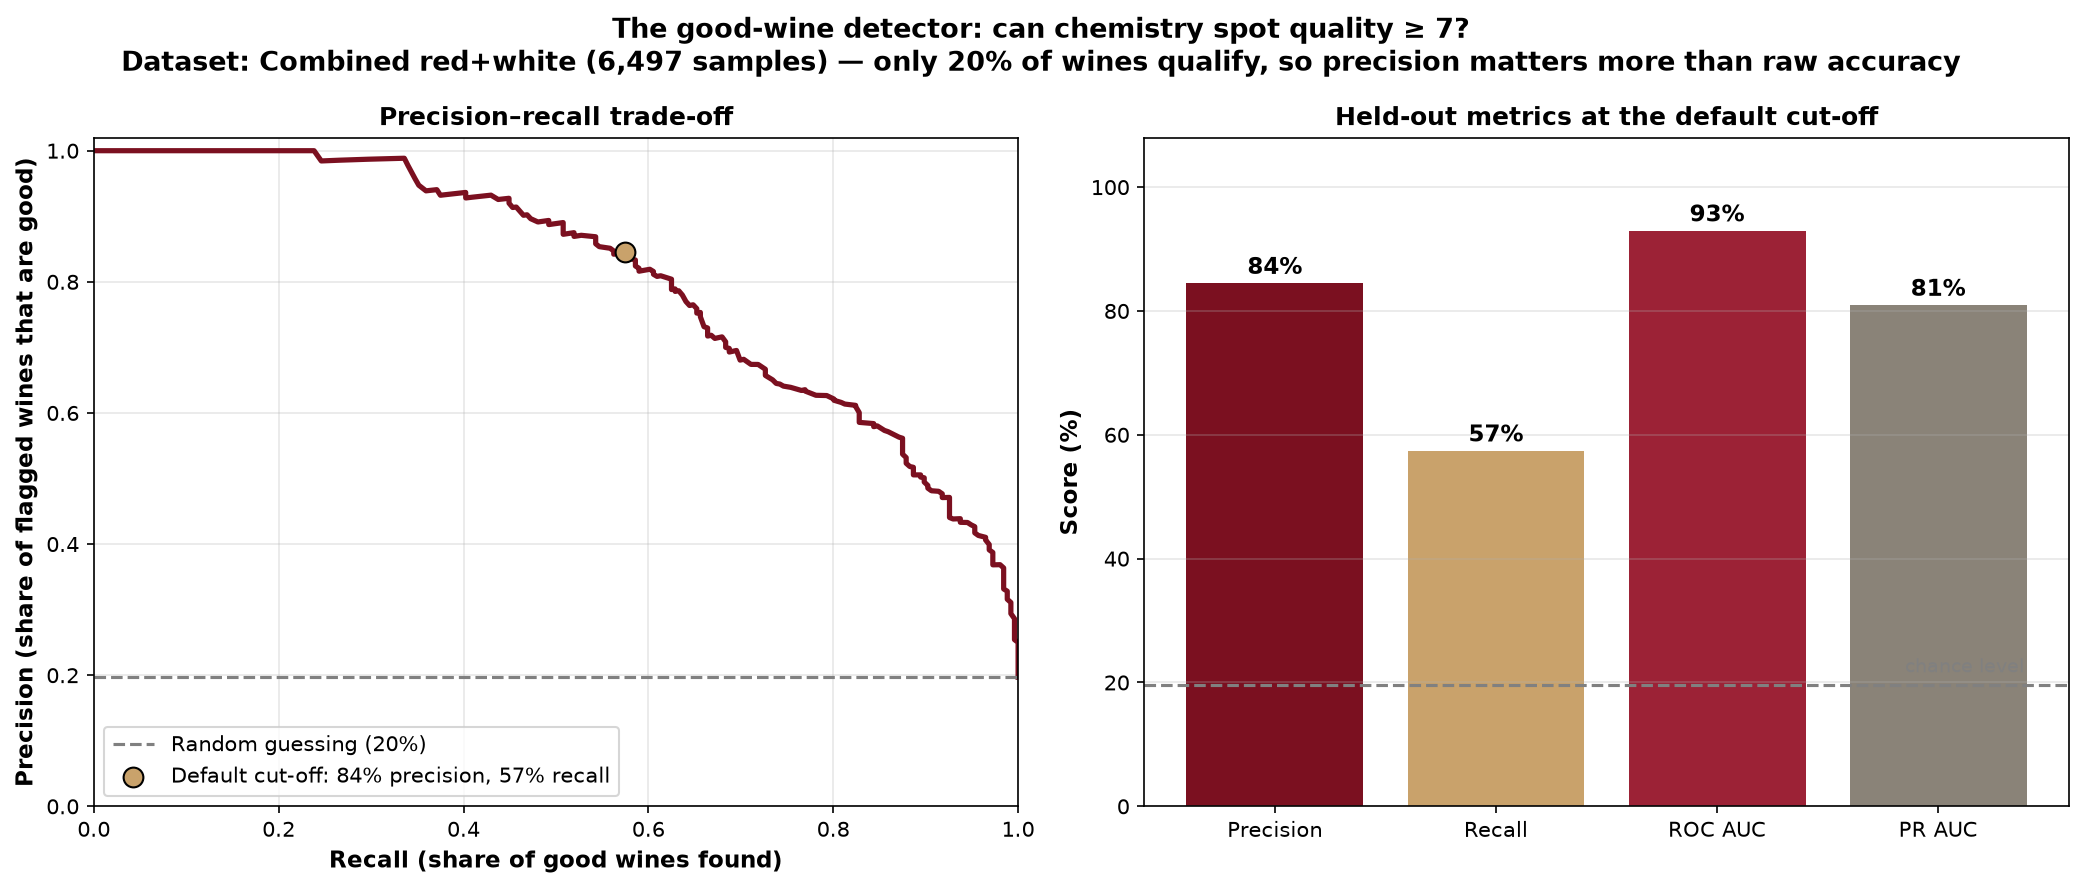
The practical reading: chemistry is a high-precision, moderate-recall filter. It won't surface every good bottle, but what it does flag is trustworthy — four out of five flagged wines genuinely scored 7+.
09The contrast result: colour is in the chemistry, quality mostly isn't
The cleanest way to show that the quality model's ceiling is a property of the target, not the data: train the same model, on the same eleven measurements, to predict colour instead of quality. It is right 99.8% of the time — three errors in 1,300 held-out wines. Red and white barely overlap in chemical space; quality tiers overlap almost entirely.
10Natural wine styles (PCA + clustering)
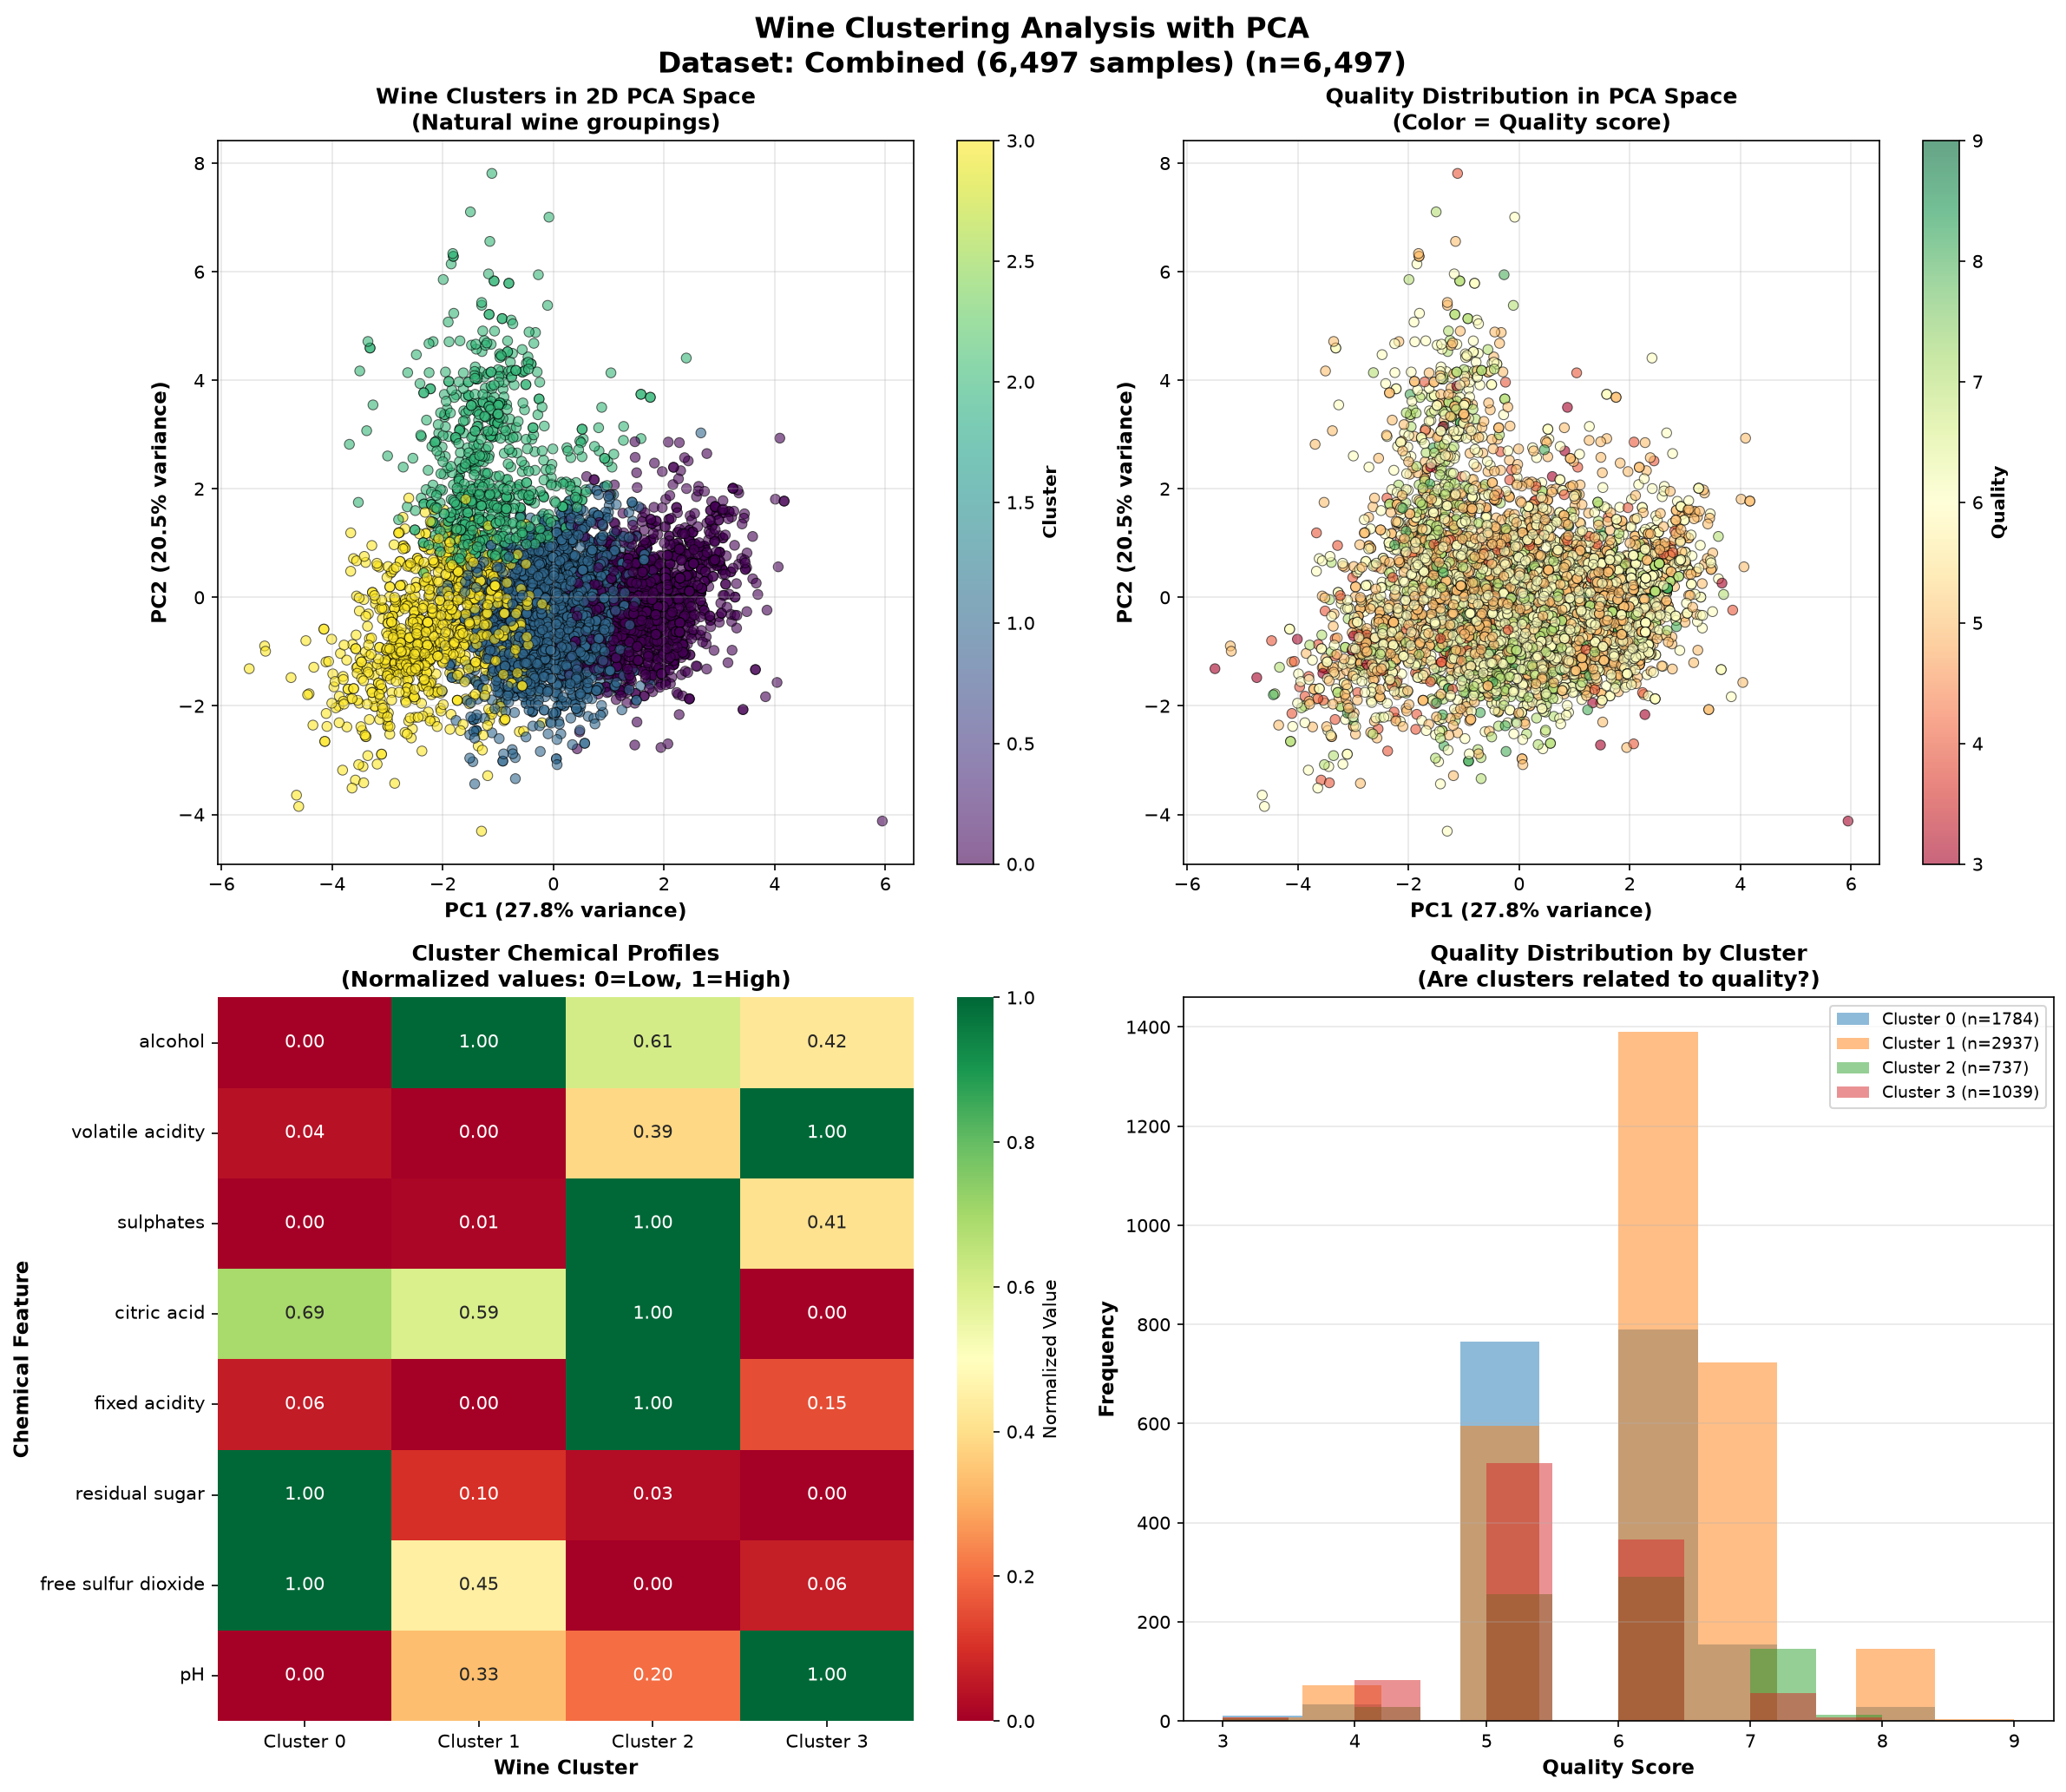
Reducing the chemistry to two principal components (capturing 48.4% of variation) and running K-means surfaces four recurring style groups — essentially a light-to-full body spectrum modulated by acidity and sulphates. They are real chemical groupings, but they track quality only loosely.
| Cluster | Share | Avg alcohol | Avg quality |
|---|---|---|---|
| 1 — Full-bodied | 45.2% | 11.2% | 6.09 |
| 2 — Spicy & crisp | 11.3% | 10.5% | 5.78 |
| 0 — Light-bodied | 27.5% | 9.5% | 5.64 |
| 3 — Medium-bodied | 16.0% | 10.2% | 5.39 |
11Oxidation risk & taste mapping
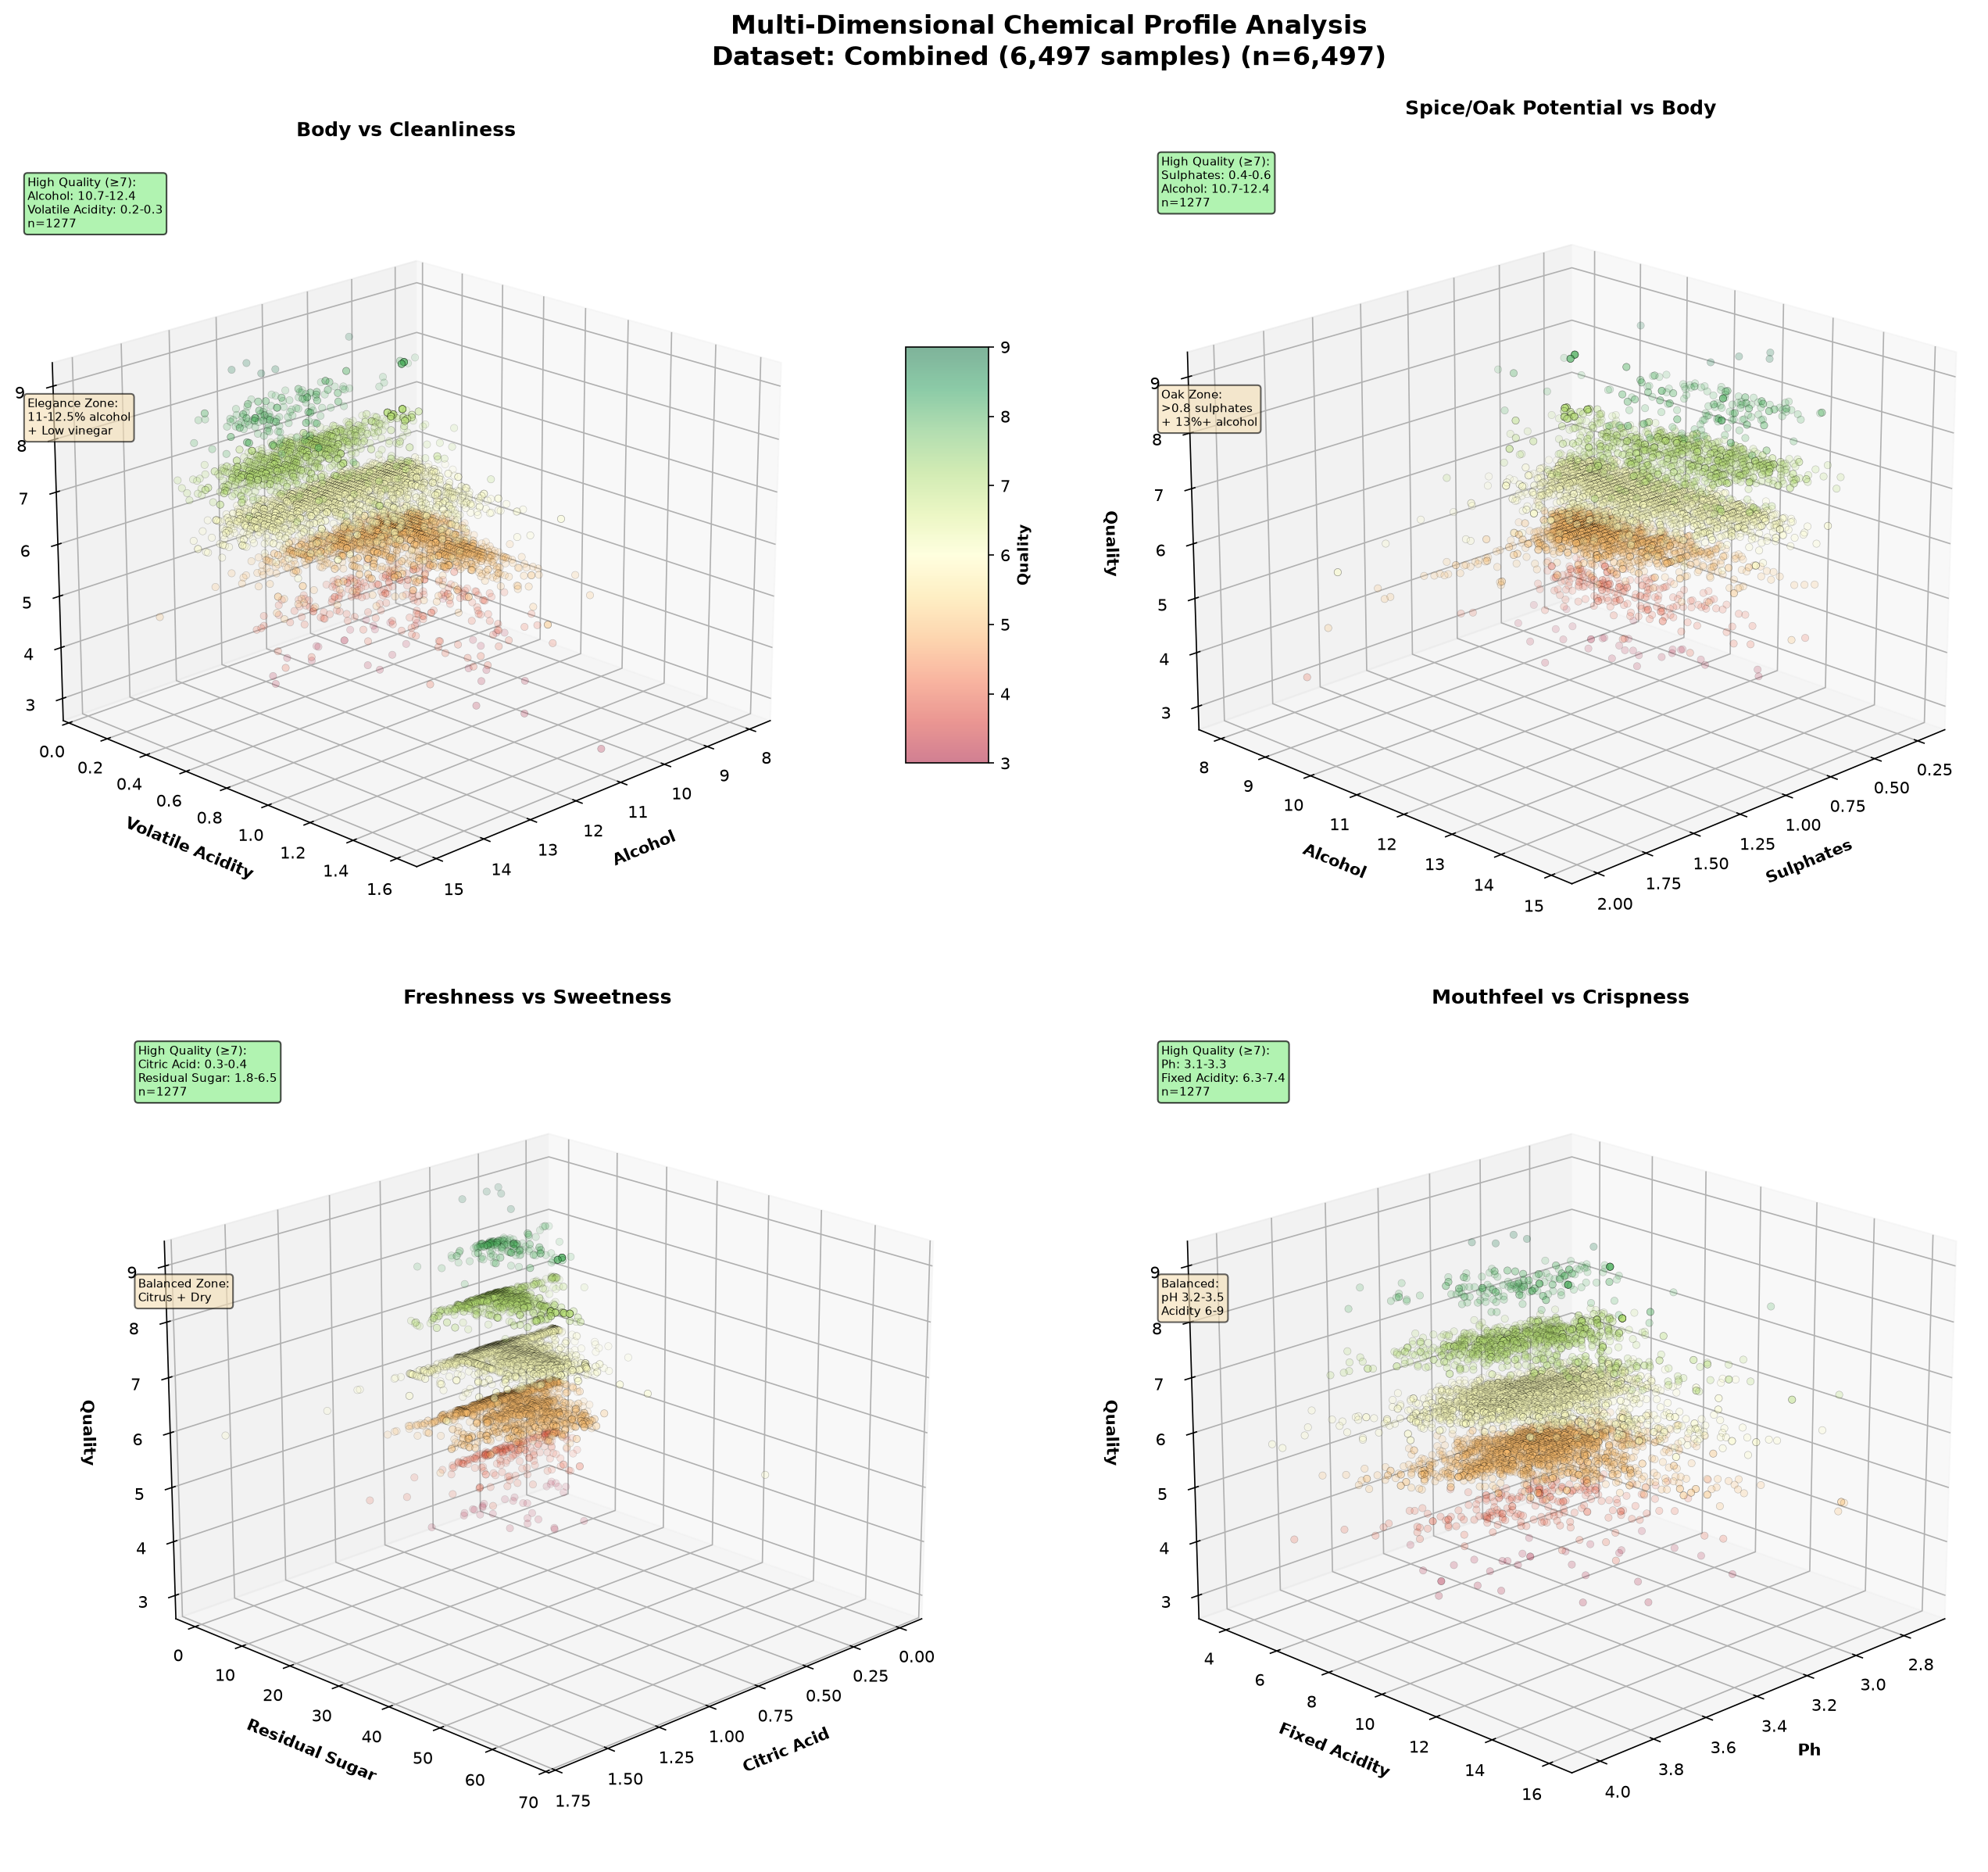
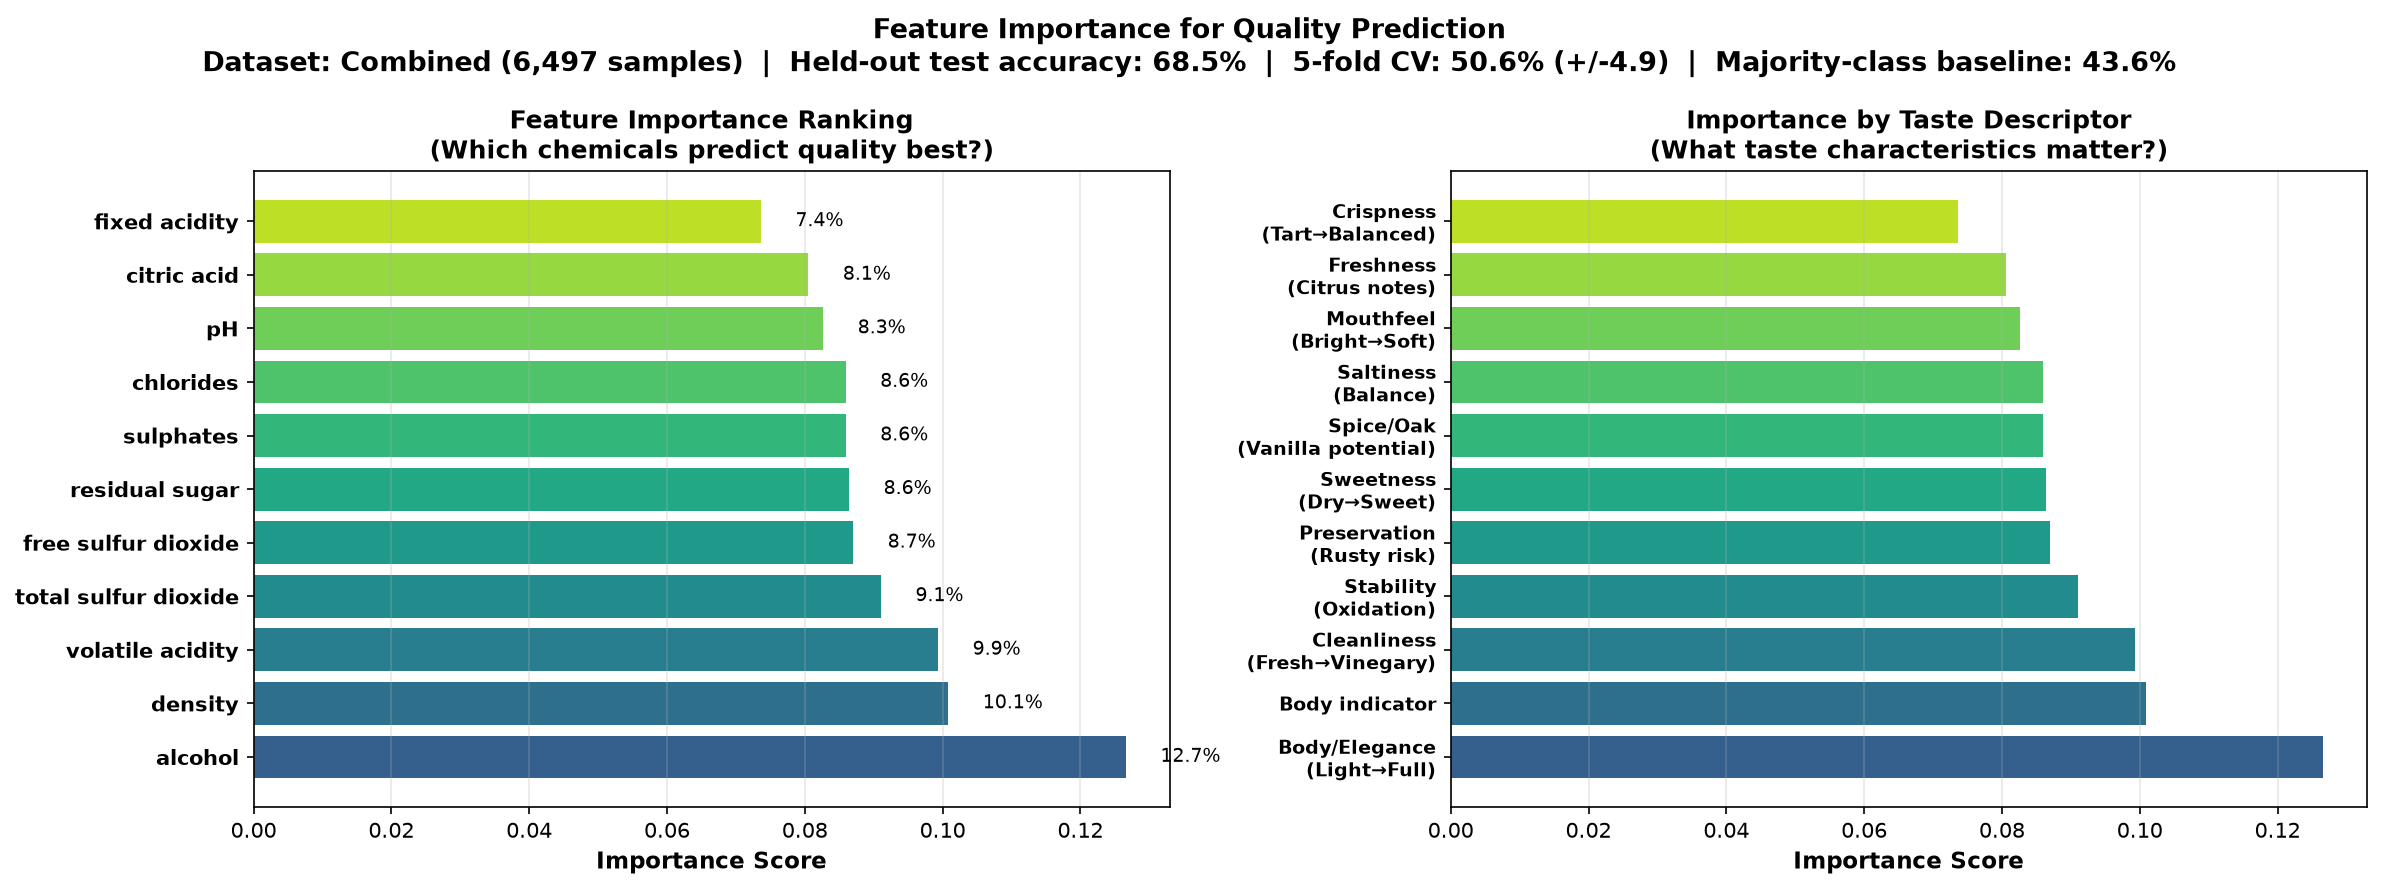
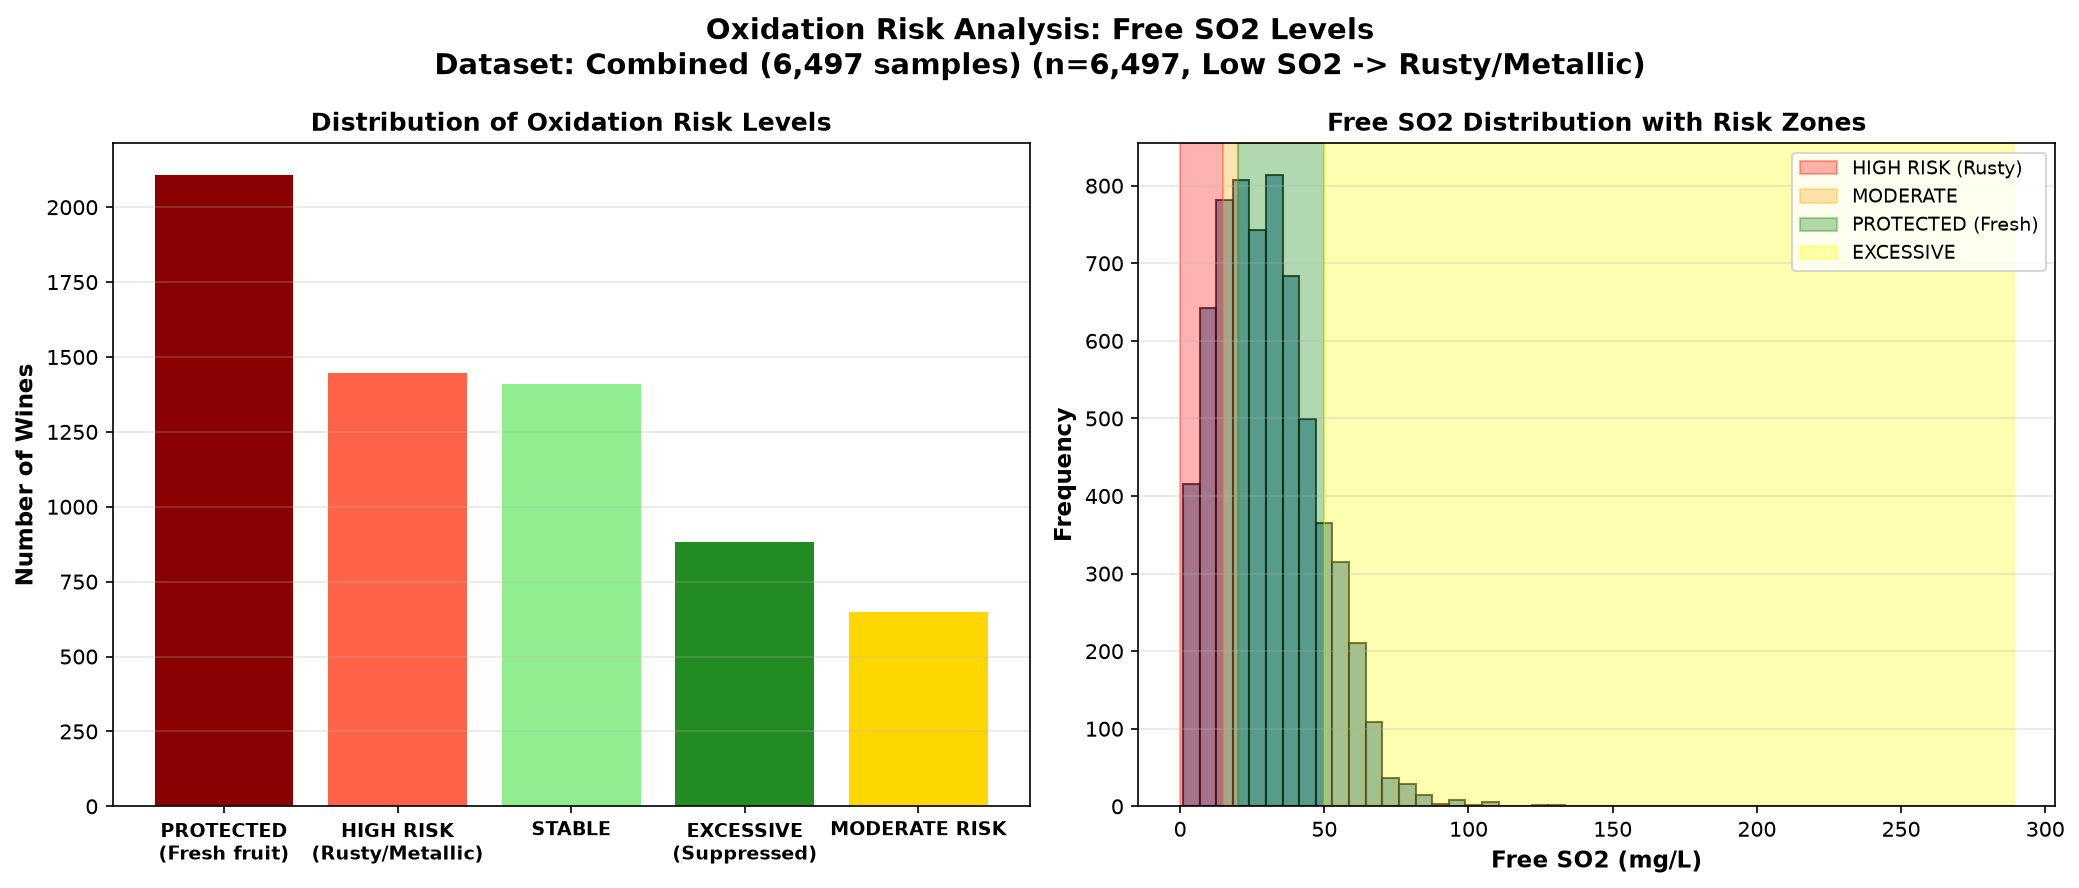
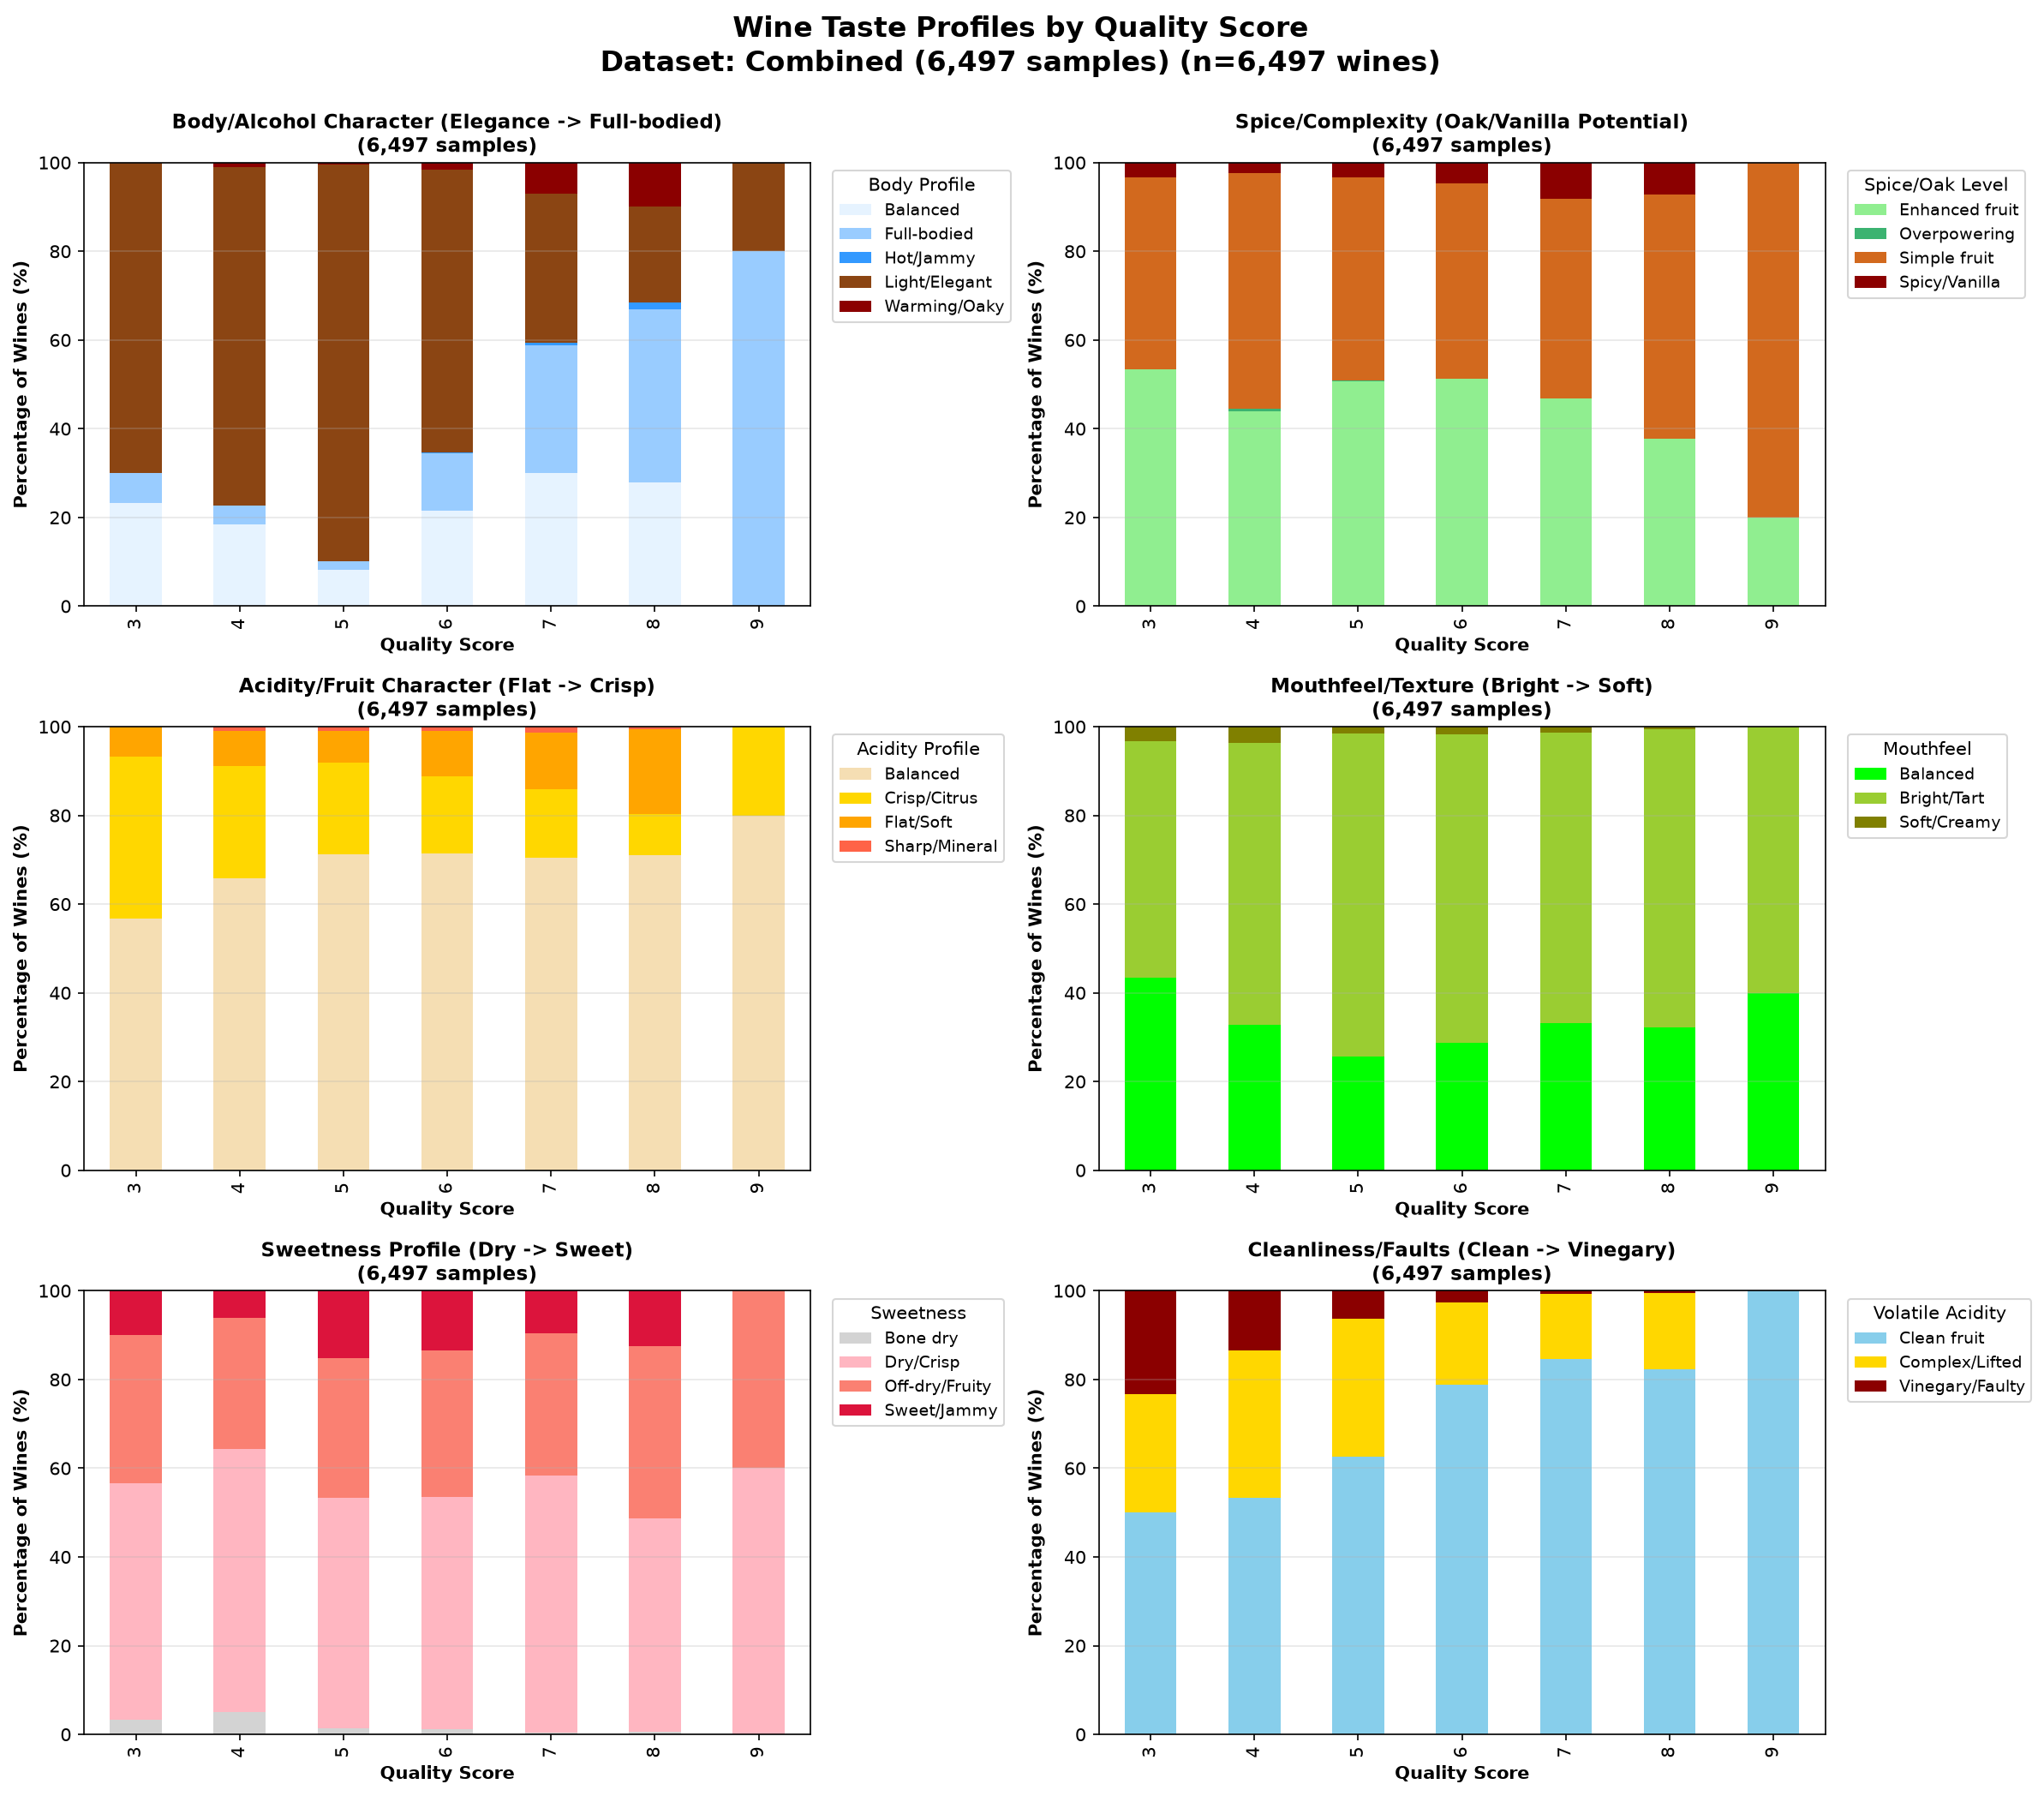
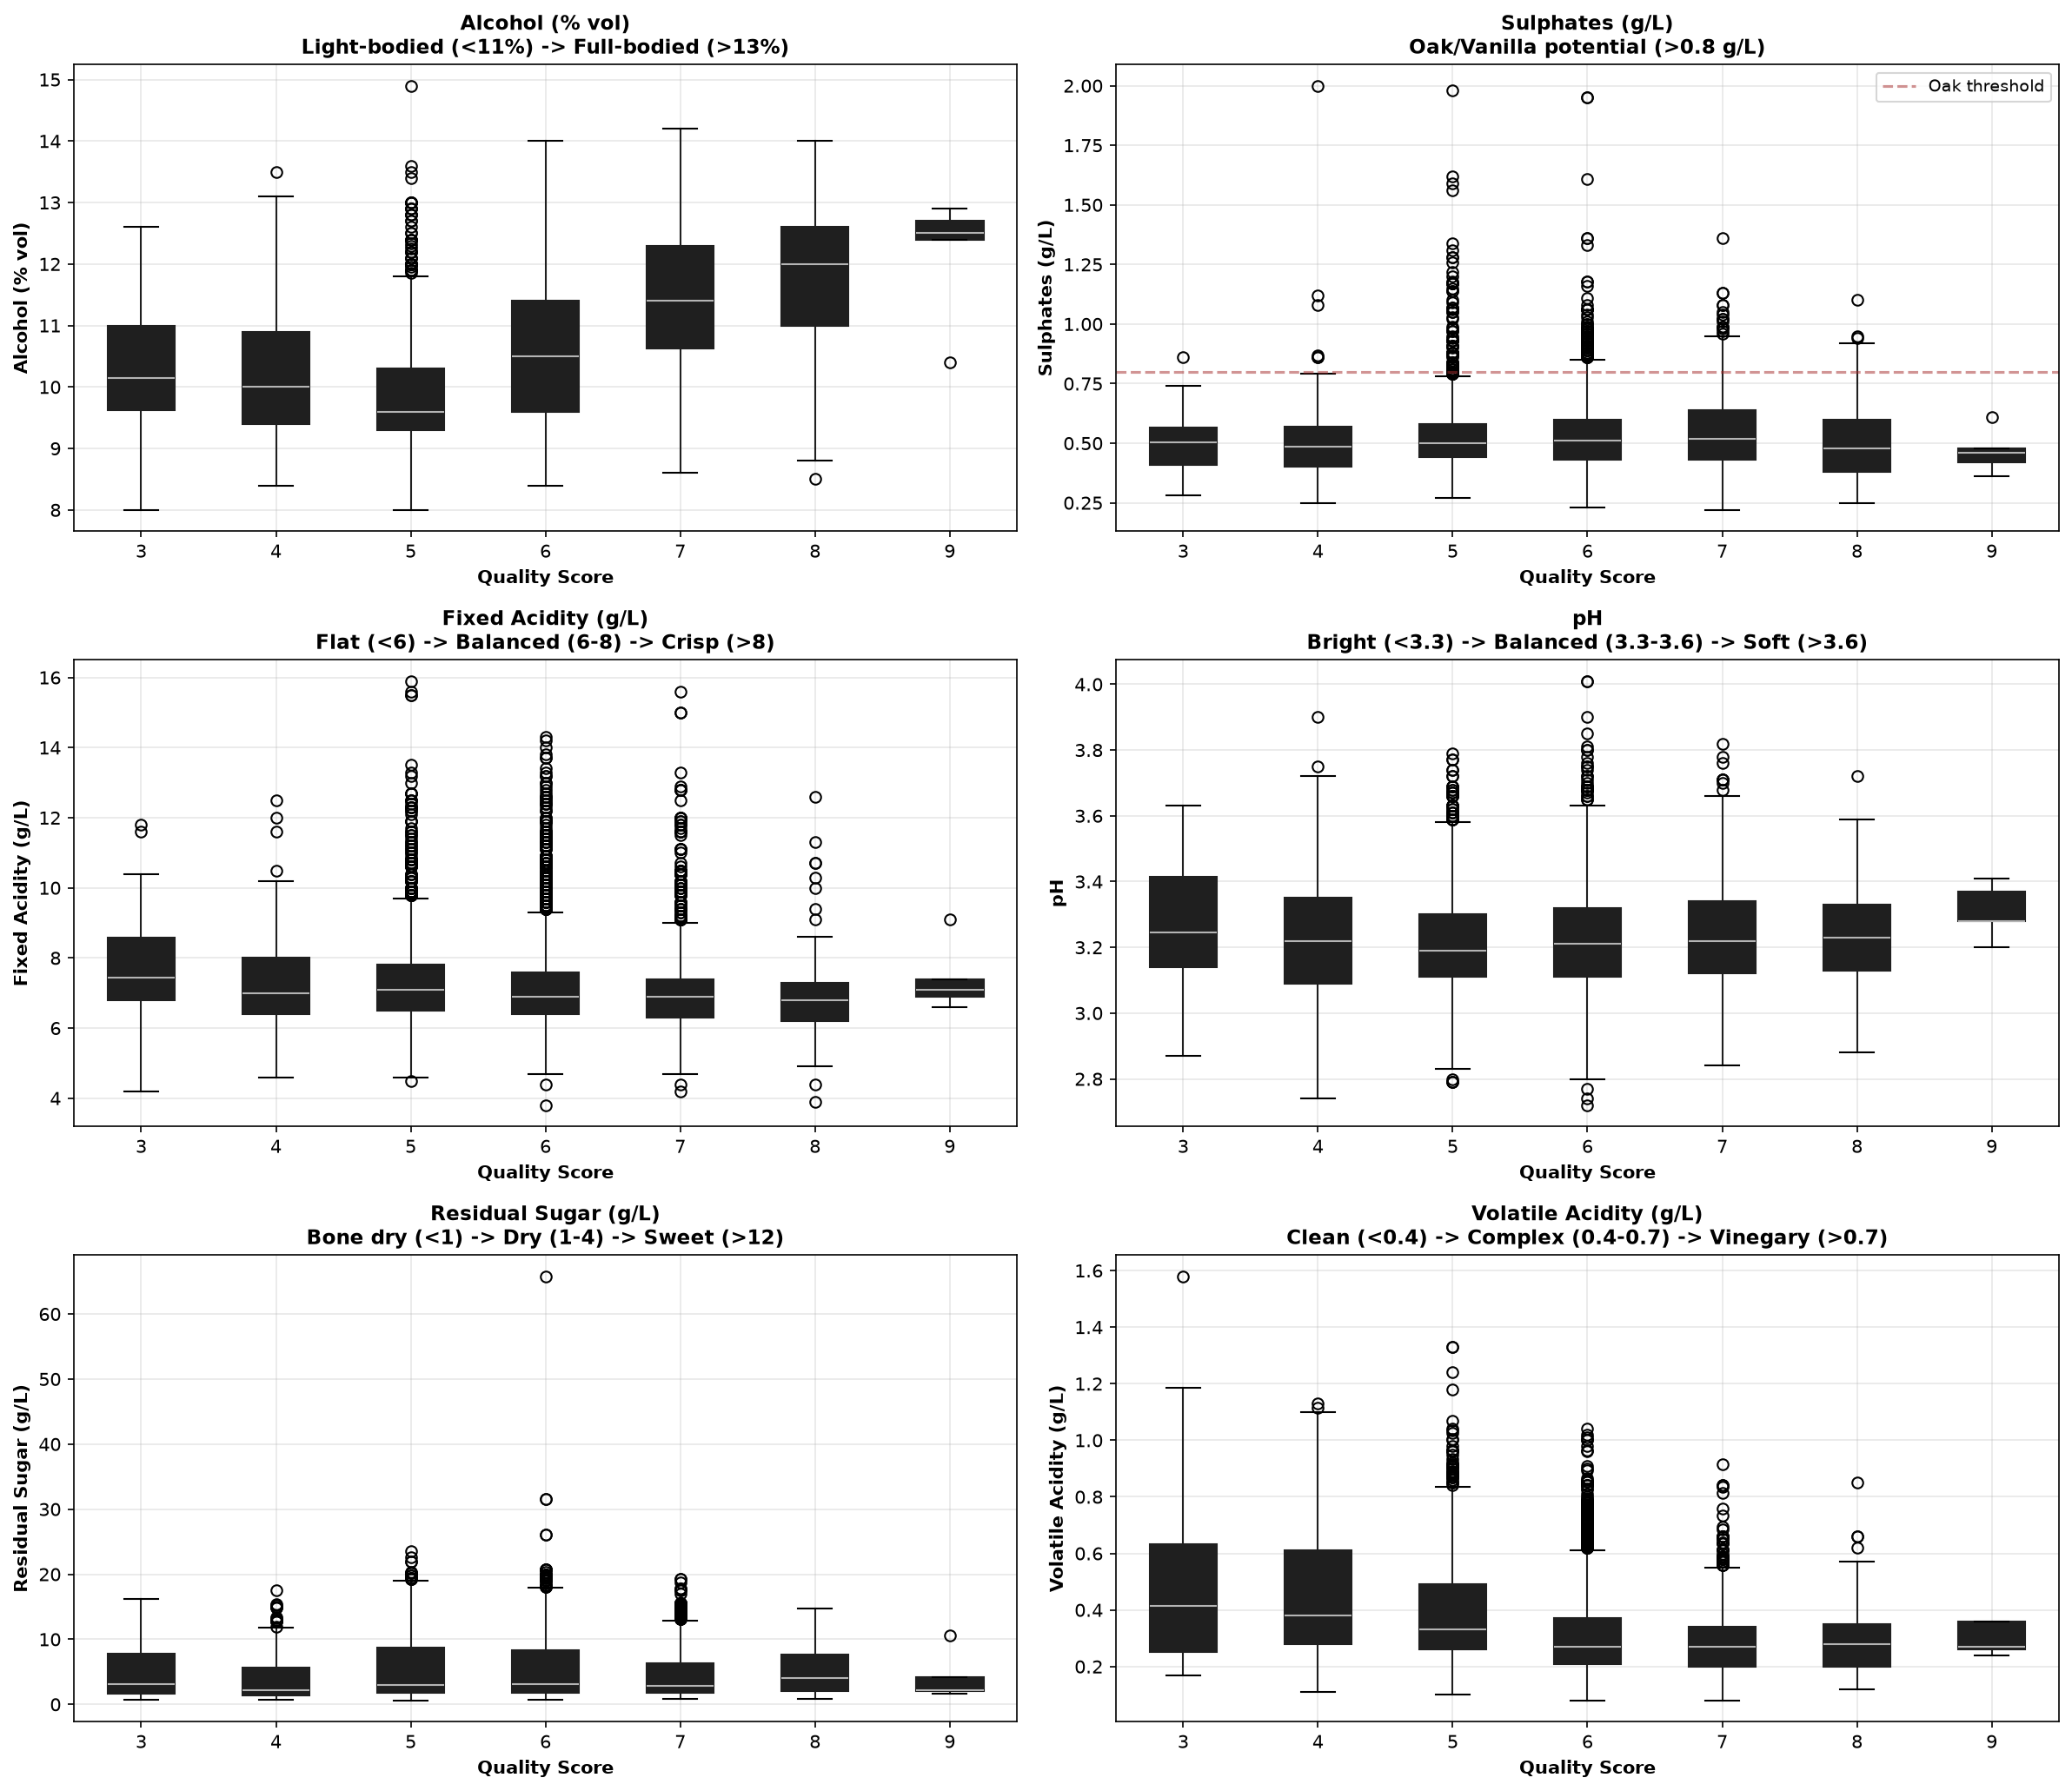
Free SO₂ governs oxidation risk: below ~15 mg/L wines drift toward rusty, metallic notes; 20–50 mg/L preserves fresh fruit. The taste-descriptor charts translate raw chemistry into the vocabulary a taster would use — body, spice, crispness, sweetness, cleanliness.
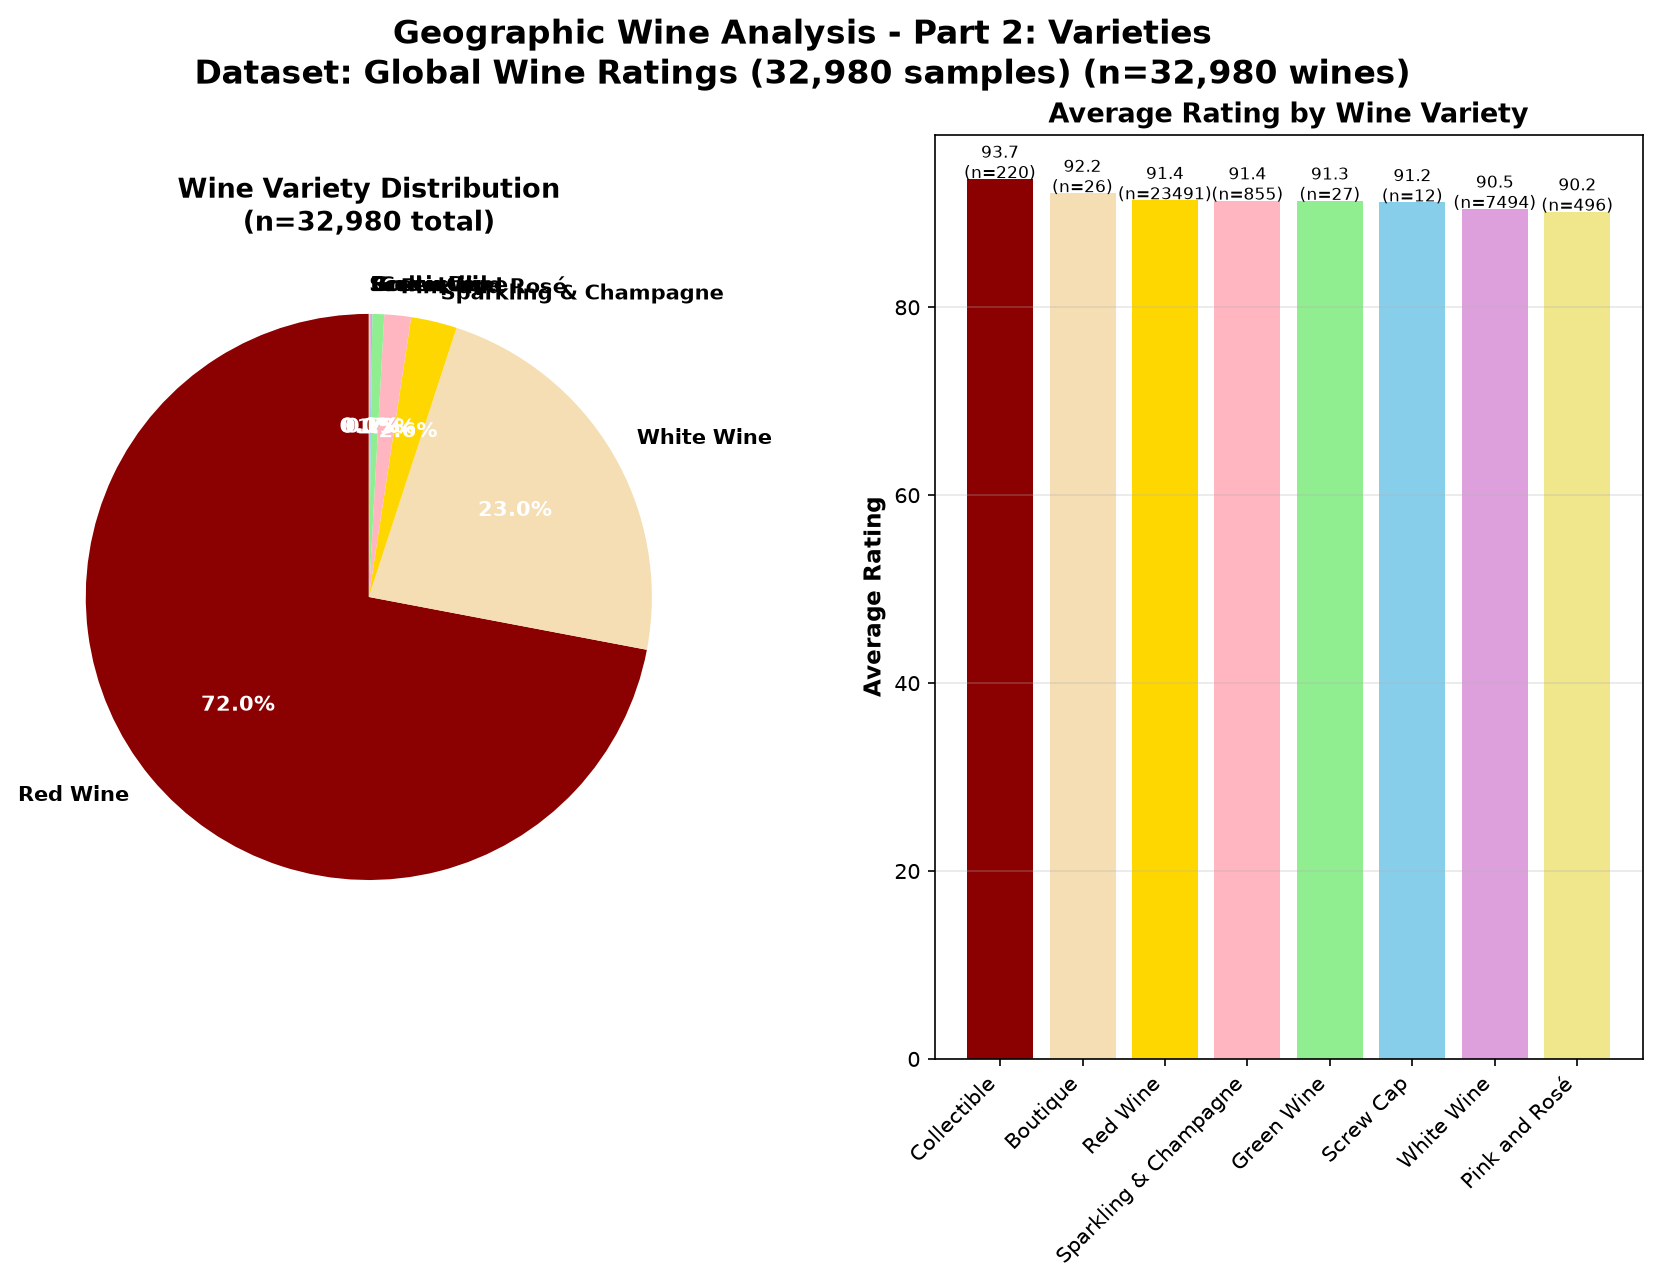
12Geography & variety
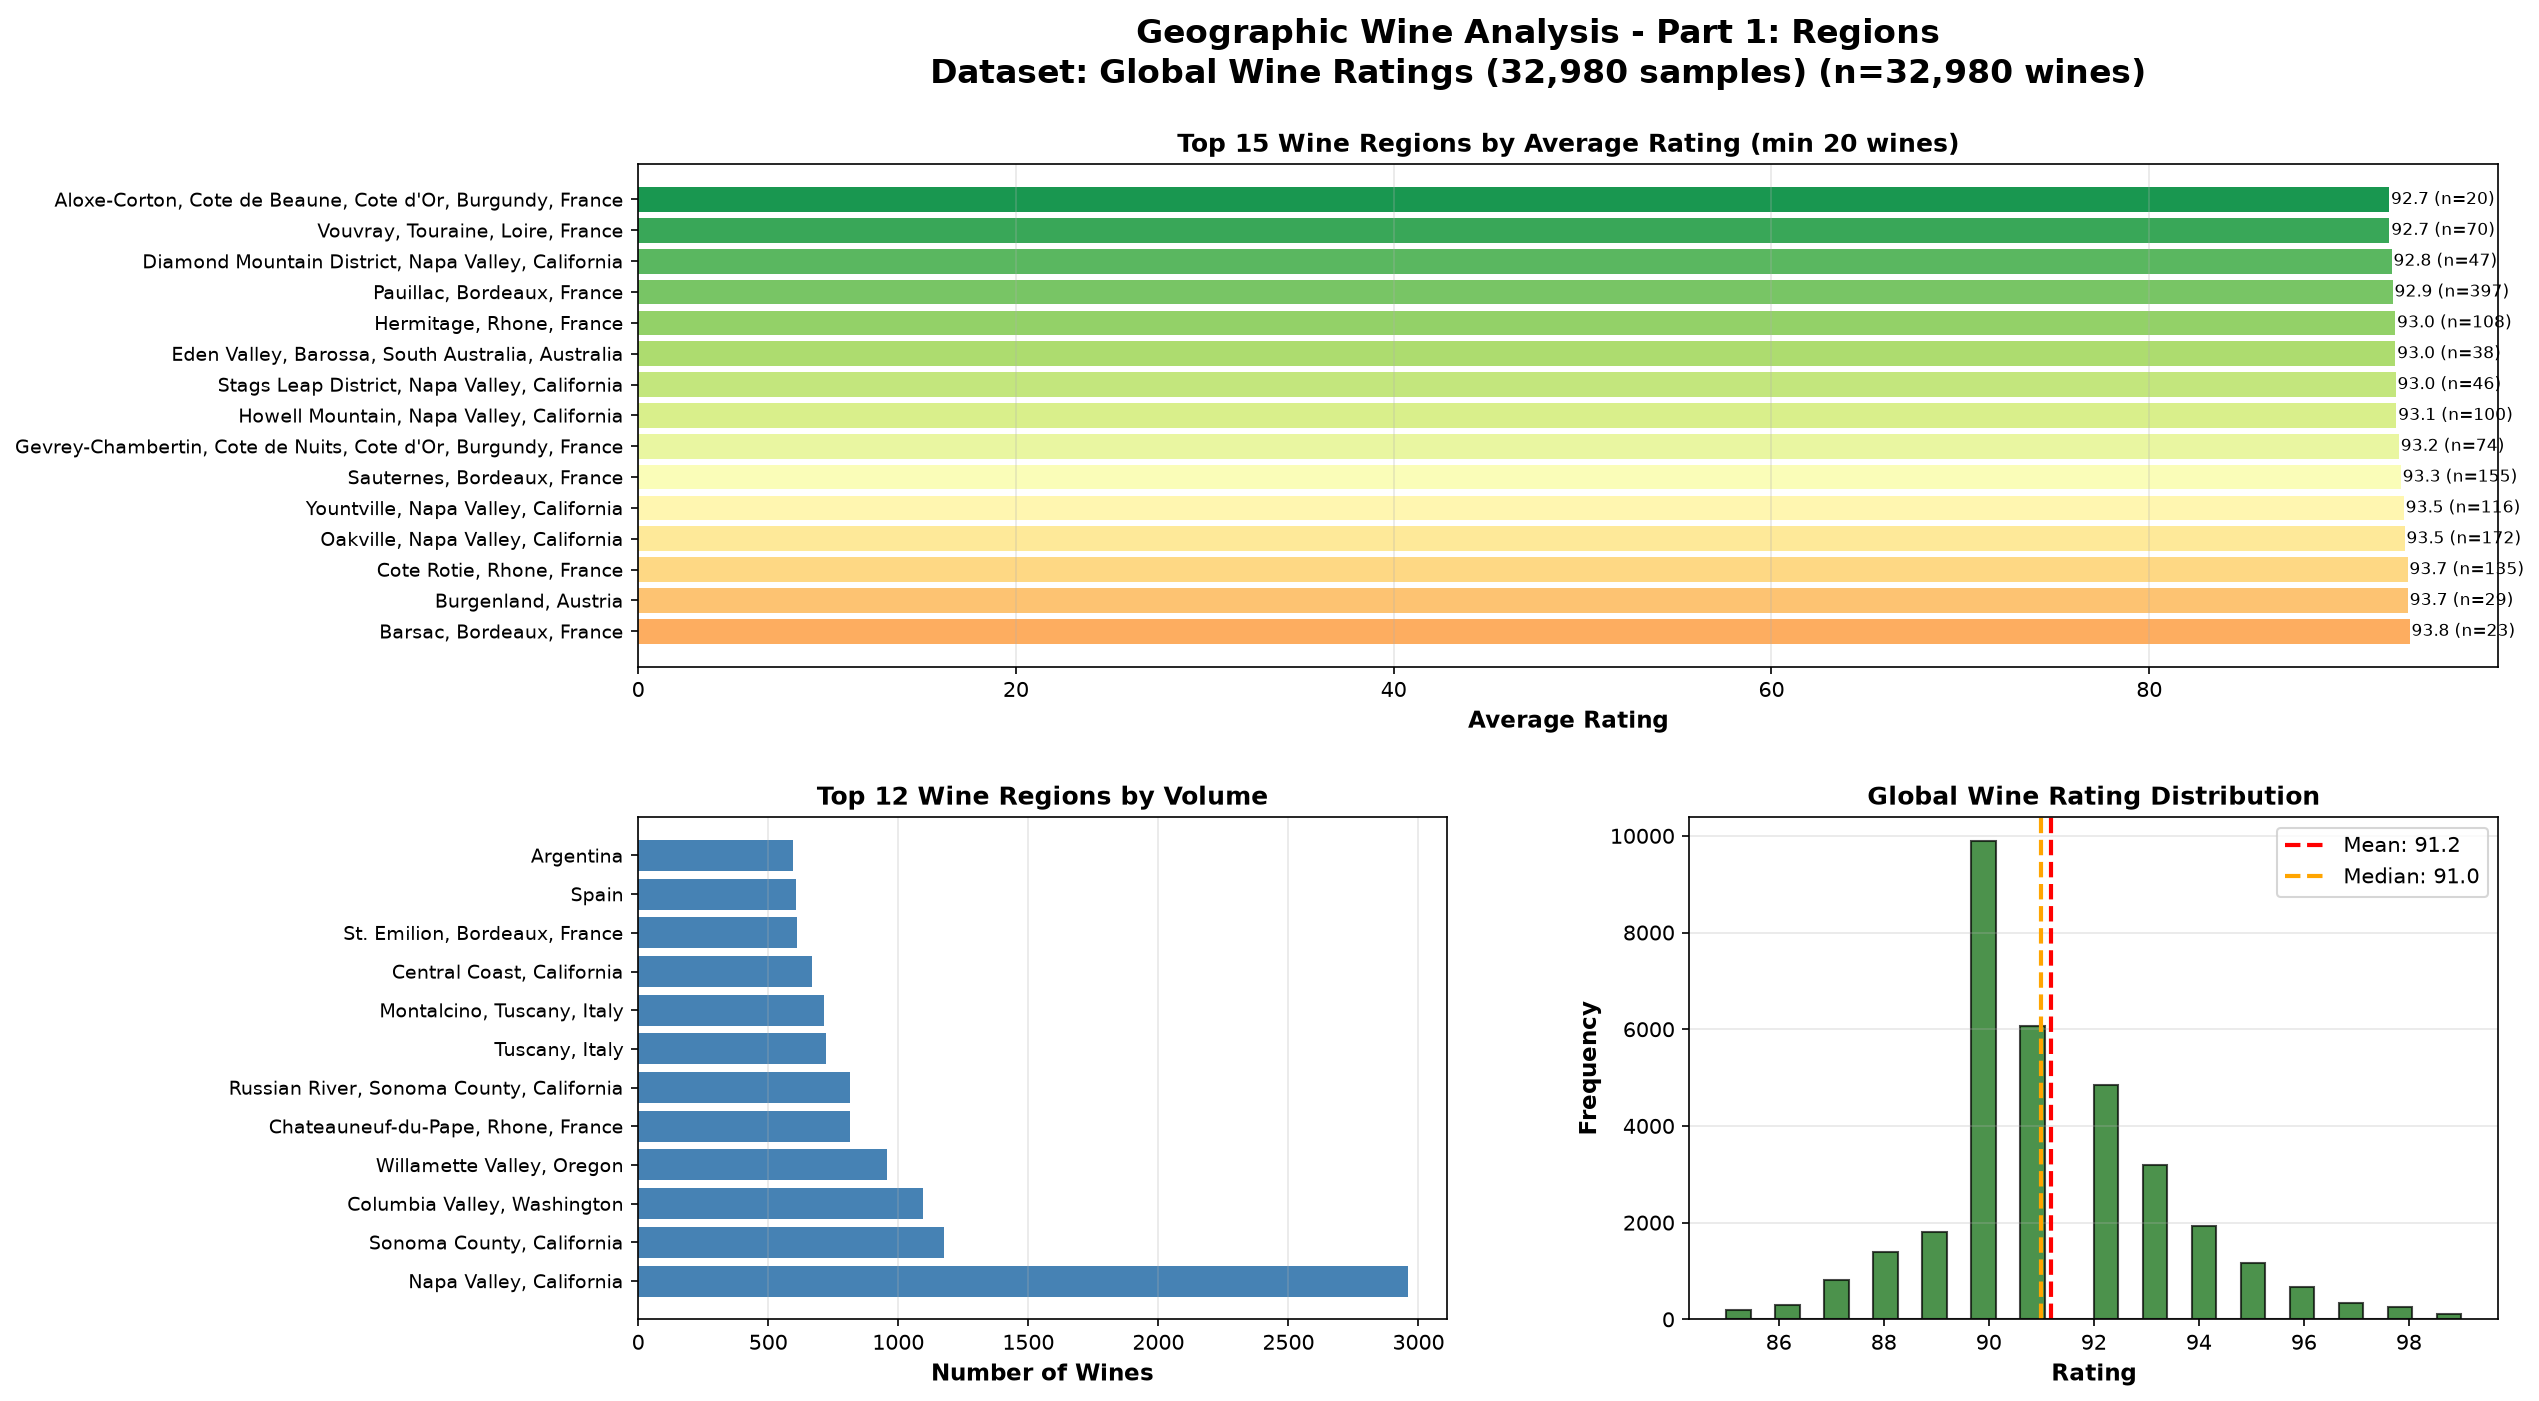
The ratings dataset maps relative standing across regions and grape varieties. One caveat matters: these are curated critic scores spanning only 85–99 (mean 91) — a selection-biased sample of already well-regarded wines. Treat the rankings as relative standing among reviewed wines, not absolute quality across all wine.
13Grapes, climates & techniques of the best wines
What the highest-rated wines have in common — mined from 32,980 wine names, regions and critic notes, then bridged back to the chemistry.
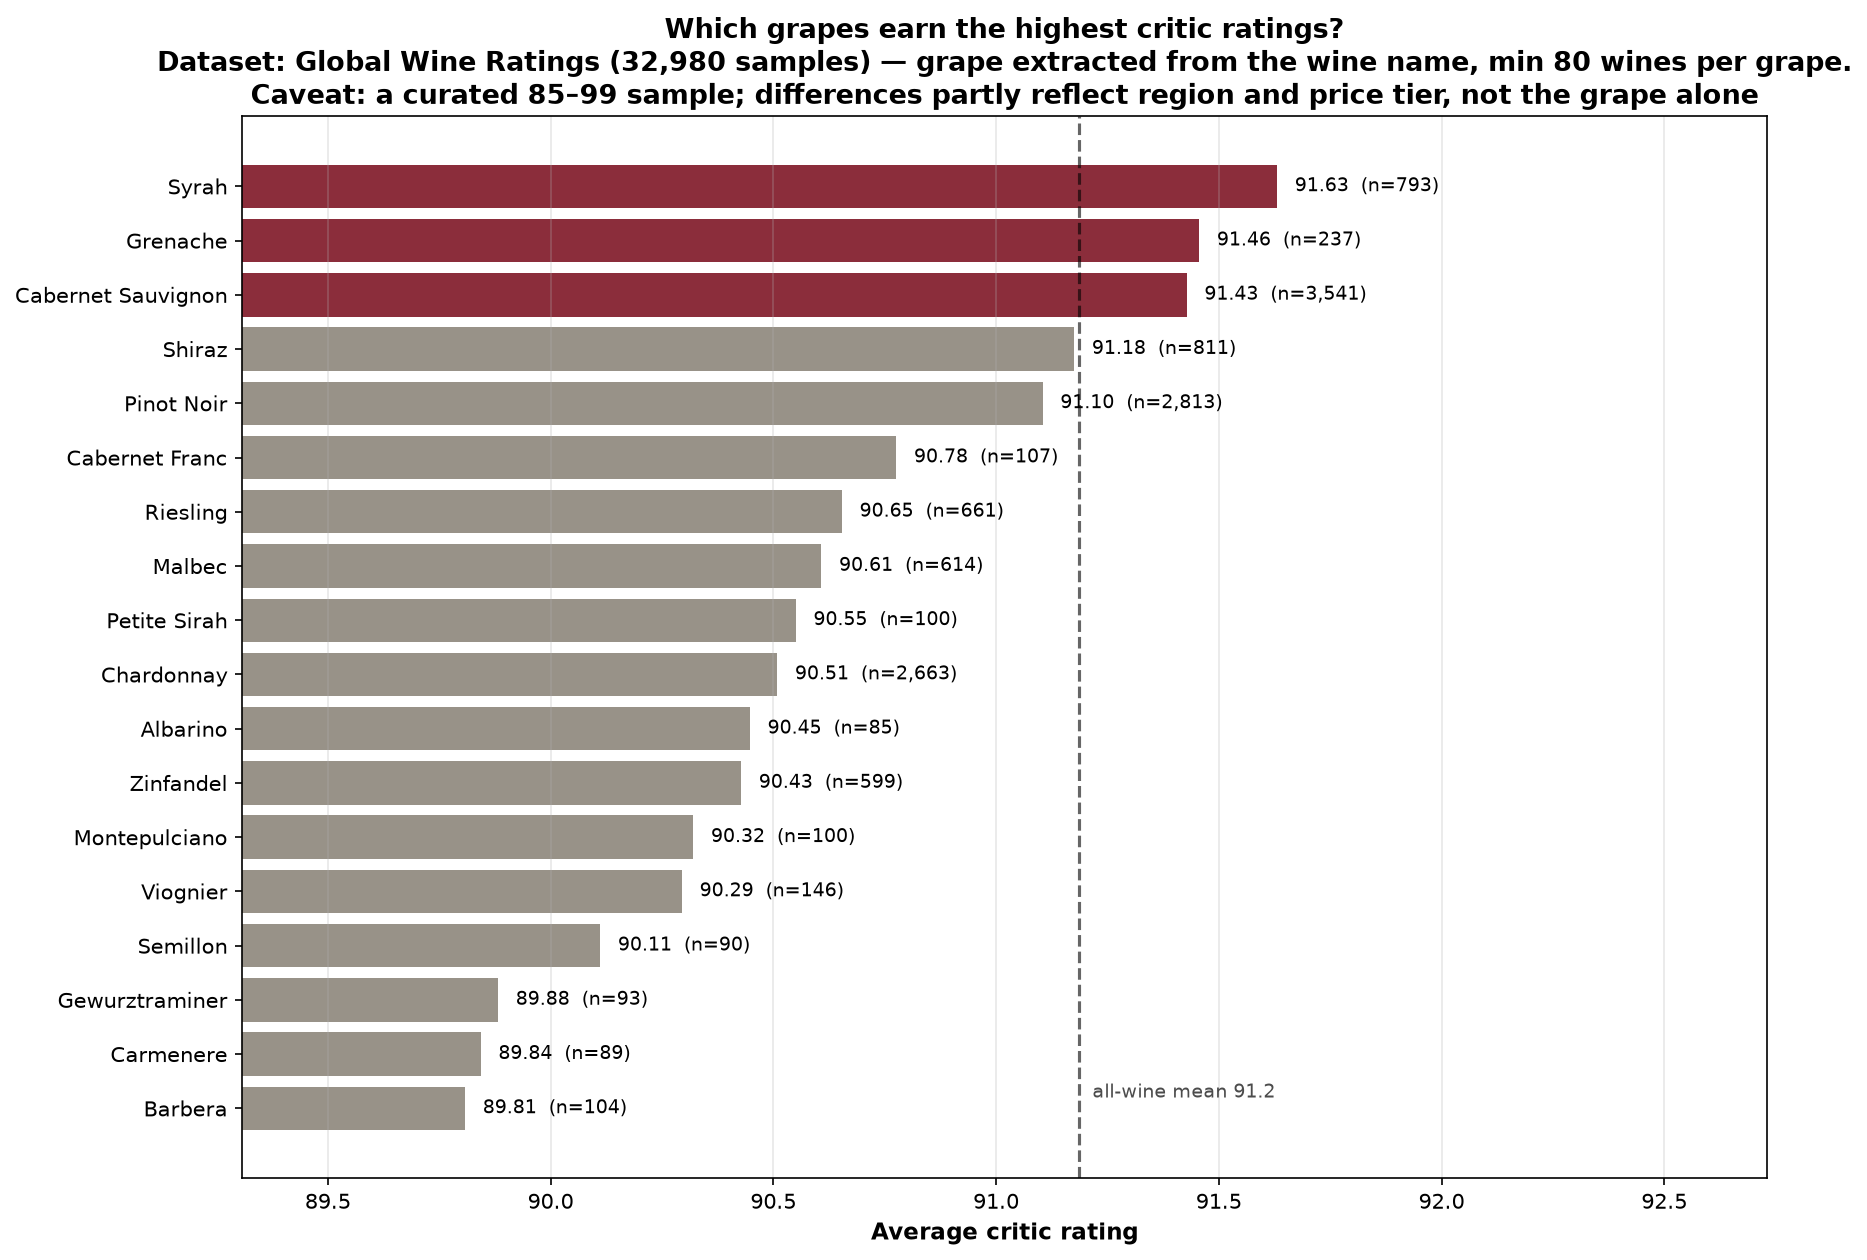
Grapes
Extracting the grape variety from each wine's name (minimum 80 wines per grape) puts Syrah, Grenache and Cabernet Sauvignon at the top of the critic table — structured, full-bodied reds, exactly the style the chemical fingerprint in section 02 predicts. Aromatic whites (Gewürztraminer, Semillon) and lighter reds (Barbera) trail by almost two points.
Climates & techniques
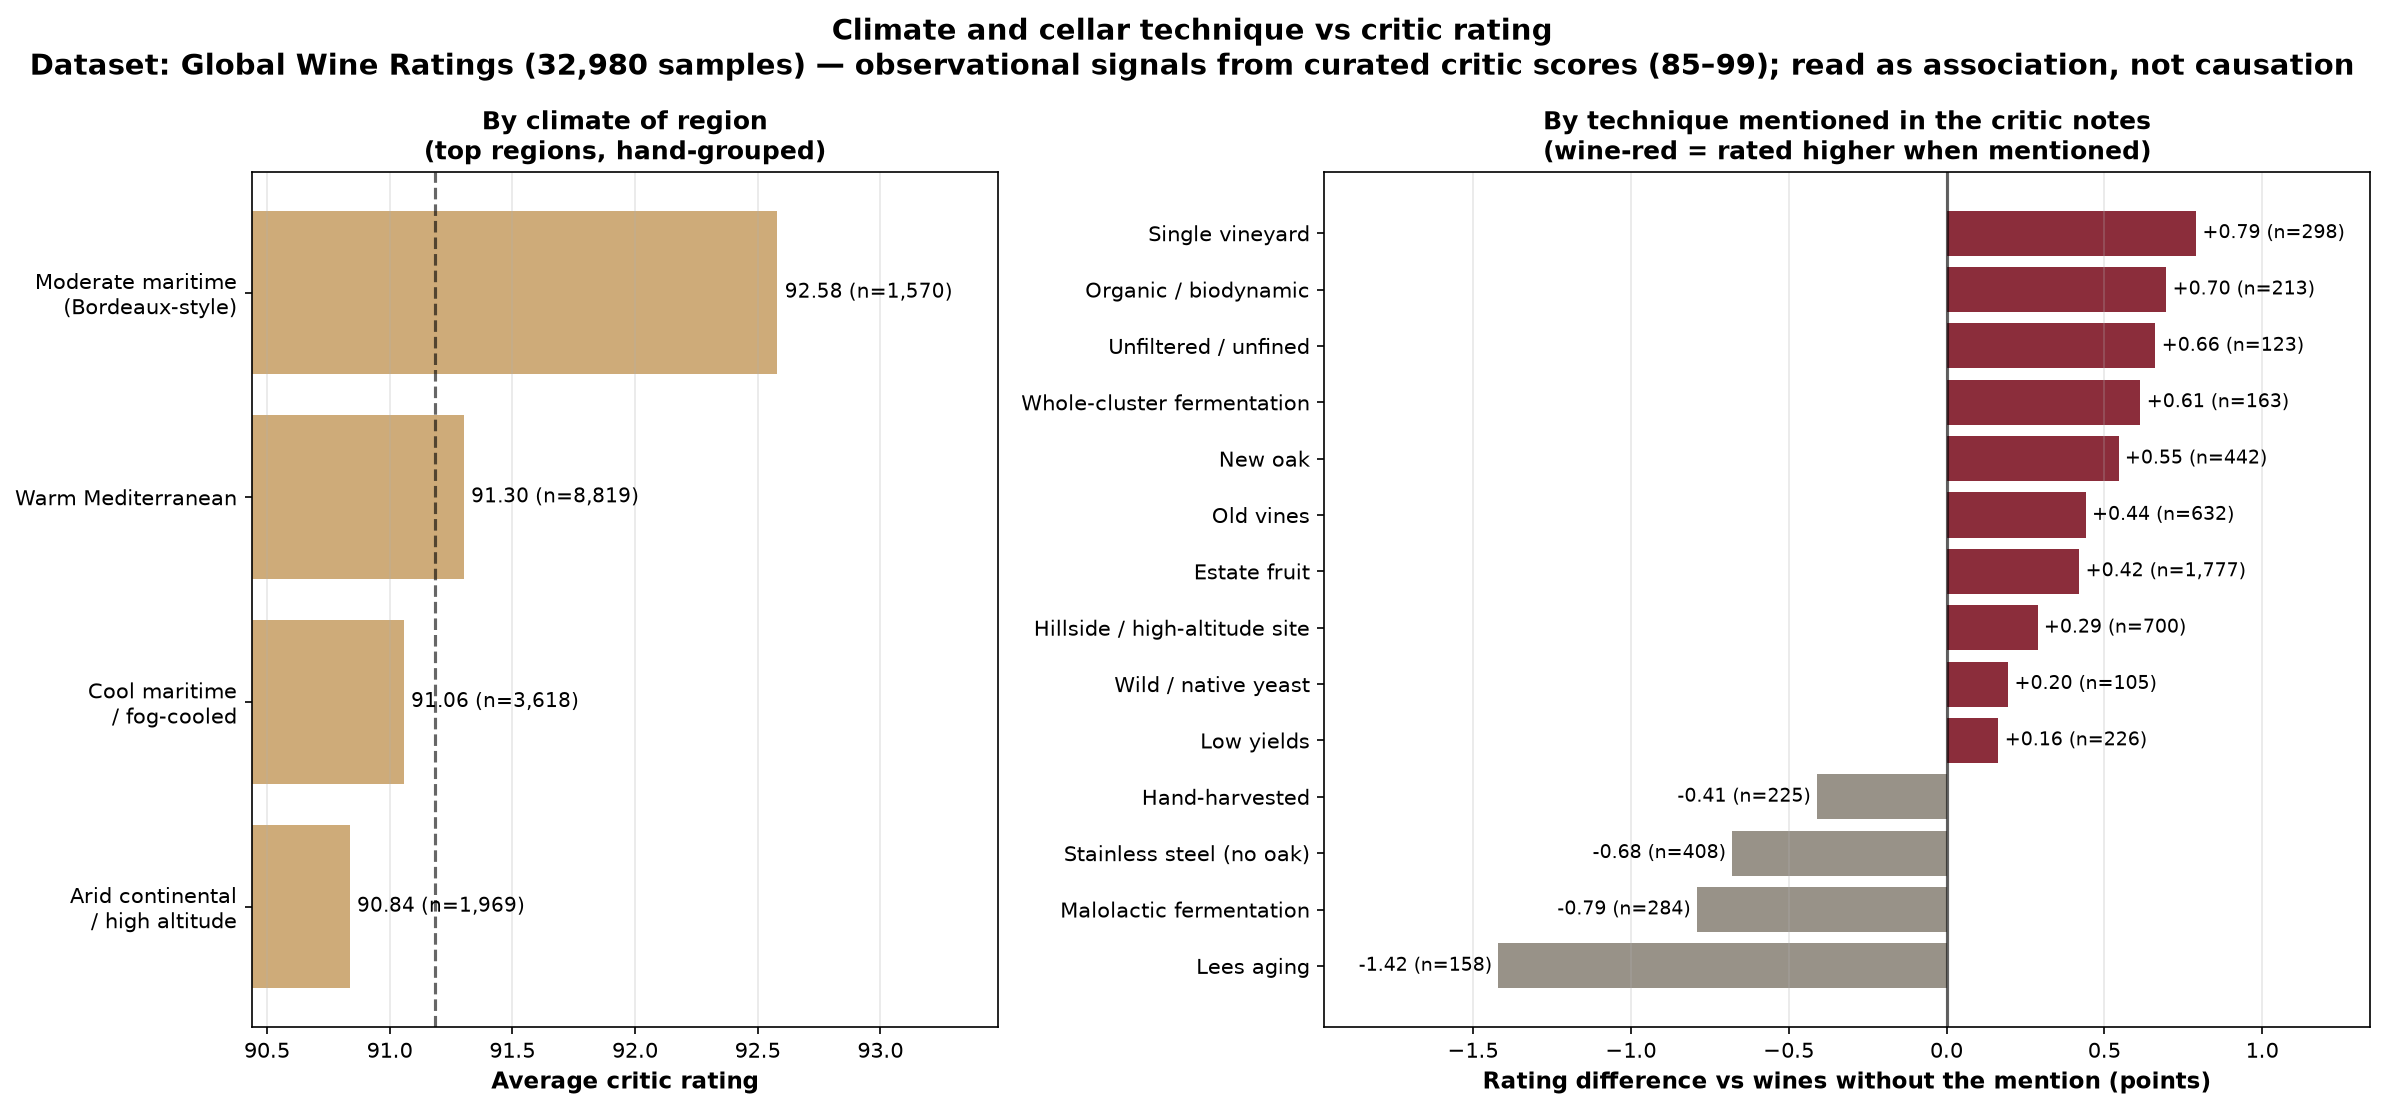
Grouping the top regions into four coarse climate buckets, moderate maritime Bordeaux leads (92.6) — though that group is built from famous appellations (Pauillac, St. Émilion, Pessac-Léognan), so prestige and price are doing part of the work. Warm Mediterranean regions (Napa, Tuscany, Châteauneuf, Barossa — 91.3) edge out cool maritime ones (91.1), consistent with the chemistry: warmth ripens fruit fully, and ripeness is what the alcohol signal is really measuring.
On technique, wines whose critic notes mention single-vineyard fruit (+0.79), organic/biodynamic farming (+0.70), bottling unfiltered (+0.66), whole-cluster fermentation (+0.61), new oak (+0.55) or old vines (+0.44) rate consistently higher than wines without the mention. Mentions of stainless-steel-only or lees aging rate lower — mostly because those describe lighter white styles, not because the techniques hurt.
From chemistry to vineyard — the specifics
Putting the two halves of the study together: the chemical fingerprint of a good wine maps onto specific, measurable viticulture and cellar targets. The "measured in good wines" column is the actual average for wines scoring 7+ in the combined dataset (n=6,497); the conditions beside it are the textbook viticulture that produces those numbers — consistent with the data, established by the wider literature rather than measured here.
Where good wines actually sit, chemically
Two numbers worth fixing first, because they anchor everything below. Good wines average pH 3.23 (middle 50% sit 3.12–3.34) and 11.4% alcohol (10.7–12.4%). The pH band is narrow and deliberate: below ~3.0 a wine tastes hard and SO₂ is over-active; above ~3.6 it tastes flabby and microbially vulnerable. Reds and whites reach it differently — good reds run pH 3.29 with ~14 mg/L free SO₂; good whites run pH 3.22 with ~35 mg/L (whites need more SO₂ because they lack protective tannin).
| Chemical signal | Measured in good wines | Terroir & climate that produces it | Cellar / process |
|---|---|---|---|
| Higher alcohol / body +0.98 SD vs rest |
11.4% abv (IQR 10.7–12.4) ≈205–230 g/L sugar at harvest |
Growing-season mean 16–19 °C; ~1,400–2,000 GDD (warm climate, Winkler II–III). Reliable late-season sun, low rainfall, free-draining poor soils (gravel, galestro, schist) that limit vigour. Yields ≤35–50 hL/ha (≈2–4 t/acre). 100–120 days hang time; pick at 22–25 °Brix. | Full, dry fermentation to <2 g/L residual sugar; healthy yeast nutrition so sugar fully converts. |
| Low volatile acidity (clean, no vinegar) |
0.29 g/L acetic (rest 0.35) well under the 0.7 g/L fault line |
Intact, disease-free fruit — dry harvest weather, no sour-rot or split berries; machine- or hand-sorting on the way in. | Cool, prompt processing; ferment red 26–30 °C, white 12–18 °C; healthy yeast inoculation to avoid stuck ferments; free SO₂ ~25–35 mg/L molecular ≥0.5 mg/L to suppress Acetobacter and Brettanomyces; topped-up, sanitised barrels. |
| Fresh acidity, balanced pH (the 10.6–11.7% route) |
pH 3.23 (IQR 3.12–3.34) citric 0.34 g/L (rest 0.32) |
Large diurnal swing (12–18 °C day–night) from altitude (400–1,500 m) or maritime/fog influence; cool nights lock in malic & tartaric acid. Earlier picking and north-facing (cooler) aspects in the northern hemisphere. | Pick on acid retention, not just sugar; partial or no malolactic for crisp whites; tartaric addition only where regulations allow and nature falls short. |
| Free SO₂ in the protected zone | 31 mg/L free (IQR 20–40) 110 mg/L total (below 150 cap) |
— (a cellar decision, not a terroir one) | Hold free SO₂ 25–45 mg/L through élevage (the 20–50 protected band on this page); top barrels weekly to exclude oxygen; minimal racking; bottle with molecular SO₂ ≥0.5 mg/L. Total SO₂ stays well under the ~150–200 mg/L legal caps. |
| High sugar + cleanliness (dessert-wine route) |
residual sugar >12.6 g/L & volatile acidity ≤0.20 g/L |
Late harvest or noble rot (Botrytis cinerea) — needs humid mornings then dry, breezy afternoons (Sauternes, Tokaj, Mosel Auslese). Grapes left to 30–40+ °Brix, picked berry-by-berry over multiple passes. | Slow, cool ferment that stops with residual sugar intact (chilling, high alcohol, or sterile filtration); meticulous sorting keeps volatile acidity low despite the rot. |
GDD = growing degree days; °Brix ≈ sugar concentration (1 °Brix ≈ 0.55% potential alcohol); hL/ha = hectolitres per hectare; IQR = middle 50% of good wines. Climate and process figures are standard viticultural references, not quantities measured in this study.
The strongest caveat on this page
Everything in this section is observational and selection-biased: the ratings span only 85–99, the notes are written by people selling the wine, and grape, region, price and prestige are tangled together. The deltas are real but small (under one point). Read this as what already-celebrated wines have in common, not as a recipe that would cause high scores.
14Limitations
- Quality is subjective and coarse. The 0–10 target is a panel median; most wines sit at 5–6, which caps how well any model can do — and inflates "within ±1" scores for every method, baseline included.
- Rare scores are effectively unpredictable. The confusion matrix shows scores 3, 4, 8 and 9 are almost never predicted, regardless of headline accuracy.
- Correlations and tree rules are observational. No causal claims about winemaking are supported; the decision tree describes scored wines, it doesn't prescribe how to make one.
- The good-wine detector trades recall for precision. At the default cut-off it misses 43% of good wines; lowering the threshold finds more at the cost of false alarms (see the precision–recall curve).
- The ratings set is selection-biased (critic scores 85–99) and its chemistry is absent, so it can't be merged with the lab datasets.
- Grape, climate and technique signals are confounded with region, price and prestige, and technique mentions come from marketing-written notes — they describe well-regarded wines, they don't explain them.